The haze is back in Singapore. How does it compare with past occurrences?新加坡又开始出现雾霾了。与以往的情况相比,这次的雾霾情况如何?
Haze-belching fires in Kalimantan and Sumatra have driven PSI levels up in Singapore. What affects air quality here, and how does the current situation compare with previous episodes?
Haze-belching fires in Kalimantan and Sumatra have driven PSI levels up in Singapore. What affects air quality here, and how does the current situation compare with previous episodes?
In recent weeks, South-east Asia has been seeing persistent haze, with air quality in Singapore reaching the upper end of the moderate range and, on some days, the lower end of the unhealthy range.
Singapore’s 24-hour Pollutant Standards Index (PSI), which measures air quality, first entered the unhealthy range on the morning of Sept 4. The PSI went back up again this week, reaching 106 on the morning of Sept 10.
Air quality is considered unhealthy when the PSI is above 100, during which the National Environment Agency (NEA) advises the public to cut down on outdoor activities.
The last time the PSI hit unhealthy levels due to haze was in October 2023.
PSI levels in Singapore have not yet reached levels seen in 2015 or 2019
The haze has been caused by raging fires in Indonesia and if they continue, there is a risk of smoke haze affecting Singapore even further.
How did the haze reach Singapore’s shores again? It began with fires in the forests and peatlands of Sumatra and Kalimantan.
Dense smoke haze had been seen over southern and central Sumatra and various parts of Kalimantan on most days since Aug 21.
The smoke was then carried northwards by winds from the south, bringing haze towards Singapore.
Air quality breached unhealthy levels on Sept 4. Analysis by the Copernicus Atmosphere Monitoring Service showed aerosol plumes reaching Singapore and beyond.
This map shows fire hot spots detected in Indonesia in the week of Aug 31, based on data from NASA. The smoke reached Singapore as winds blew from the south.
Many fire hot spots were found within concession areas , where land is allocated for commercial use such as plantations. Some of these concessions overlap with peatlands , which are naturally wet ecosystems that can become highly flammable when they are drained for plantations.
In comparison, the fire hot spots detected during the week of Sept 21 – the peak week in 2015 – were concentrated in similar areas, although the number of hot spots was much higher.
Note: Concession areas are based on palm oil concession data from Global Forest Watch and wood pulp concession data from Trase, as well as data on mining business areas from Indonesia’s Ministry of Energy and Mineral Resources. The information is publicly available data and may not be comprehensive of all concession areas.
Forest fires in Indonesia are more easily ignited during the dry season, which typically runs from June to October. In 2026, the fire season is compounded by a “Godzilla” El Nino, which brings hotter and drier conditions.
The combination has stirred memories of 2015, which was also an El Nino year. Fires from Indonesia sent Singapore’s PSI to above 300 in September – into the hazardous range – prompting schools to close for a day. In Indonesia, the haze was linked to about half a million cases of respiratory infection.
How the number of fire hot spots in Indonesia compares across the years, as detected by NASA’s satellite
Source: NASA FIRMS, VIIRS/Suomi NPP active fire data, data as at Sept 10
Weather experts tell The Straits Times that a repeat of such a disaster in 2026 seems unlikely. This is because the current El Nino started later than the 2015 cycle. The El Nino in 2015 had an onset in April and a longer impact on the dry season than this year, said NEA.
In comparison, the 2026 El Nino started around June. The number of hot spots over Sumatra and Kalimantan so far is lower than in 2015.
NEA noted that there could still be periods of haze, especially during prolonged dry spells.
“The severity and duration of haze episodes will depend on how the ground situation subsequently develops and the extent of fires,” said the agency.
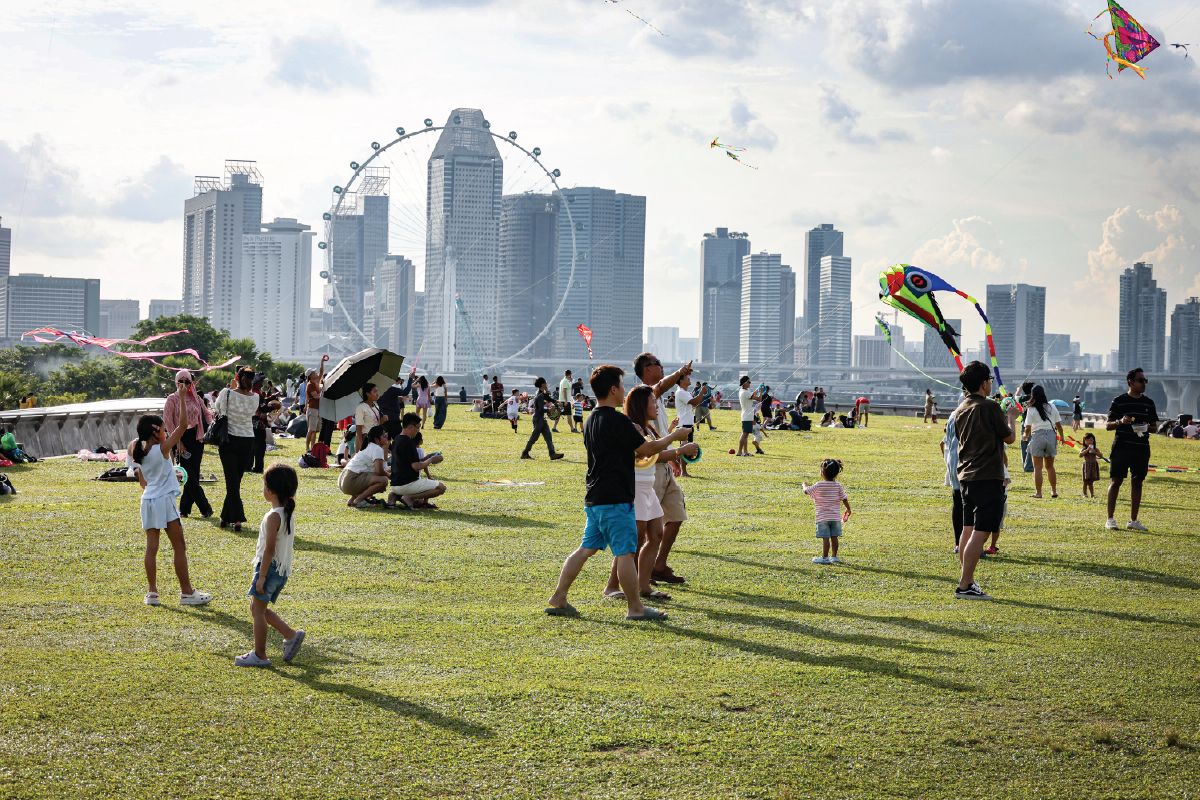
Here’s a comparison of Marina Barrage, before and during the haze this year
People flying kites outdoors at the Marina Barrage in June, before the haze. PHOTO: Lianhe Zaobao
Hazy conditions seen in southern Singapore from the Marina Barrage on Sept 4. The 24-hr PSI for central Singapore was 112. ST PHOTO: Ariffin Jamar
What is causing the widespread fires in Indonesia?
Fire is widely used as a cheaper option for agricultural land clearing by both smallholders and plantation companies, as burning costs far less than machines, said Dede Sulaeman, research lead for peatland monitoring at World Resources Institute Indonesia.
Many of the hot spots are seen on plantation land, called concessions, he added. “Concessions represent land with full control by companies, which should play a significant role in preventing fires and achieving a zero-fire target,” said Dede.
His colleague Muslih Biladi, a land use and supply chain analyst, said: “Many companies still struggle to keep fires from breaking out, and even large firms continue to see hot spots turn up in their subsidiaries’ concessions or in supplier areas near their production sites.”
Agricultural land in Sumatra and Kalimantan has been a tinderbox for decades since waterlogged peatlands were drained for plantations, making the land dry and flammable.
El Nino just amplifies human-caused burning. “The risk is therefore highest when human activities occur in already degraded or drained landscapes and coincide with prolonged drought,” Dede said.
What to do when the haze reaches unhealthy levels
Check the air quality before heading out and monitor Singapore’s 24-hour PSI and one-hour PM2.5 readings to understand current conditions.
NEA also provides health advisories based on PSI levels, including guidance on what you can do to protect yourself. Check NEA’s advisory for the latest recommendations.
When the PSI rises to unhealthy levels
加里曼丹和苏门答腊的野火产生的浓烟导致新加坡的空气污染指数(PSI)上升。什么因素影响新加坡的空气质量?目前的情况与以往的情况相比如何?
最近几周,东南亚地区持续出现雾霾,新加坡的空气质量达到中等水平的上限,有时甚至达到不健康水平的下限。
新加坡24小时污染物标准指数(PSI)是衡量空气质量的指标,9月4日上午首次进入不健康范围。本周PSI再次上升,9月10日上午达到106。
当空气污染指数(PSI)超过 100 时,空气质量被认为是不健康的。此时,国家环境局(NEA)建议公众减少户外活动。
上一次因雾霾导致空气污染指数(PSI)达到不健康水平是在 2023 年 10 月。
新加坡的PSI水平尚未达到2015年或2019年的水平。
印尼肆虐的野火造成了雾霾,如果野火持续燃烧,新加坡可能会受到更严重的烟霾影响。
雾霾是如何再次抵达新加坡的?这一切始于苏门答腊岛和加里曼丹岛的森林和泥炭地发生的火灾。
自 8 月 21 日以来,苏门答腊南部和中部以及加里曼丹岛部分地区几乎每天都出现浓烟。
随后,烟雾被南风吹向北方,给新加坡带来了雾霾。
9月4日,空气质量突破不健康水平。哥白尼大气监测服务中心的分析显示,气溶胶羽流已抵达新加坡及更远地区。
这张地图显示了根据美国宇航局(NASA)的数据,8月31日当周在印度尼西亚探测到的火灾热点区域。随着南风吹向新加坡,烟雾也随之而来。
许多火灾热点都出现在特许经营区内,这些区域的土地被划拨用于商业用途,例如种植园。其中一些特许经营区与泥炭地重叠,泥炭地是天然的湿润生态系统,一旦被排干用于种植园,就可能变得极易燃烧。
相比之下,2015 年 9 月 21 日当周(高峰周)检测到的火灾热点集中在类似区域,尽管热点数量要高得多。
注:特许经营区域数据基于全球森林观察组织(Global Forest Watch)提供的棕榈油特许经营数据、Trase提供的木浆特许经营数据以及印尼能源和矿产资源部提供的采矿业务区域数据。这些信息均为公开数据,可能并未涵盖所有特许经营区域。
印尼的森林火灾在旱季更容易发生,旱季通常从6月持续到10月。2026年,厄尔尼诺现象“哥斯拉”级强势来袭,带来更加炎热干燥的气候,加剧了火灾风险。
这种组合让人回想起2015年,那一年也是厄尔尼诺现象发生的年份。印尼的山火导致新加坡9月份的空气污染指数(PSI)超过300,达到危险级别,迫使学校停课一天。在印尼,这场雾霾与约50万例呼吸道感染病例有关。
根据美国宇航局卫星探测到的数据,印度尼西亚历年来的火灾热点数量对比情况如下:
数据来源:NASA FIRMS、VIIRS/Suomi NPP 活跃火点数据,截至 9 月 10 日
气象专家告诉《海峡时报》,2026年再次发生此类灾难的可能性不大。这是因为目前的厄尔尼诺现象开始时间晚于2015年的厄尔尼诺现象。国家环境局表示,2015年的厄尔尼诺现象始于4月,且对旱季的影响时间比今年更长。
相比之下,2026年的厄尔尼诺现象大约在6月开始。迄今为止,苏门答腊岛和加里曼丹岛上空的热点数量少于2015年。
国家环境局指出,仍可能出现雾霾天气,尤其是在持续干旱期间。
该机构表示:“雾霾的严重程度和持续时间将取决于地面情况的后续发展和火灾的范围。”
以下是今年雾霾前后滨海堤坝的对比图。
六月,雾霾来临前,人们在滨海堤坝放风筝。图片来源:联合早报
9月4日,从滨海堤坝拍摄的新加坡南部地区出现雾霾天气。新加坡中部24小时气压为112磅/平方英寸。海峡时报摄影:阿里芬·贾马尔
印尼各地发生大范围火灾的原因是什么?
世界资源研究所印度尼西亚分所泥炭地监测研究负责人德德·苏莱曼表示,火烧是一种更经济的农田清理方式,小农户和种植园公司都广泛使用这种方式,因为燃烧的成本远低于机器。
他补充说,许多火灾热点都出现在被称为特许经营地的种植园土地上。“特许经营地是指公司完全控制的土地,这些公司应该在预防火灾和实现零火灾目标方面发挥重要作用,”德德说。
他的同事,土地利用和供应链分析师穆斯利赫·比拉迪表示:“许多公司仍在努力防止火灾发生,即使是大型公司也继续在其子公司的特许经营区或生产基地附近的供应商区域看到热点出现。”
几十年来,苏门答腊和加里曼丹的农业用地一直像个火药桶,因为人们排干了原本水涝的泥炭地用于种植园,导致土地干燥易燃。
厄尔尼诺现象只会加剧人为焚烧。“因此,当人类活动发生在已经退化或排水的土地上,并且恰逢长期干旱时,风险最高,”德德说。
当雾霾达到不健康水平时该怎么办
出门前请查看空气质量,并监测新加坡的 24 小时 PSI 和 1 小时 PM2.5 读数,以了解当前状况。
新加坡国家环境局(NEA)还会根据PSI等级发布健康建议,包括如何保护自己的指导。请查看NEA的建议以获取最新信息。
当PSI升高到不健康水平时