Why is Singapore’s central region registering the worst air quality during this year’s haze?为什么新加坡中部地区在今年的雾霾天气中空气质量最差?
This is partly due to high urbanisation and stronger urban heat, say experts. Read more at straitstimes.com.
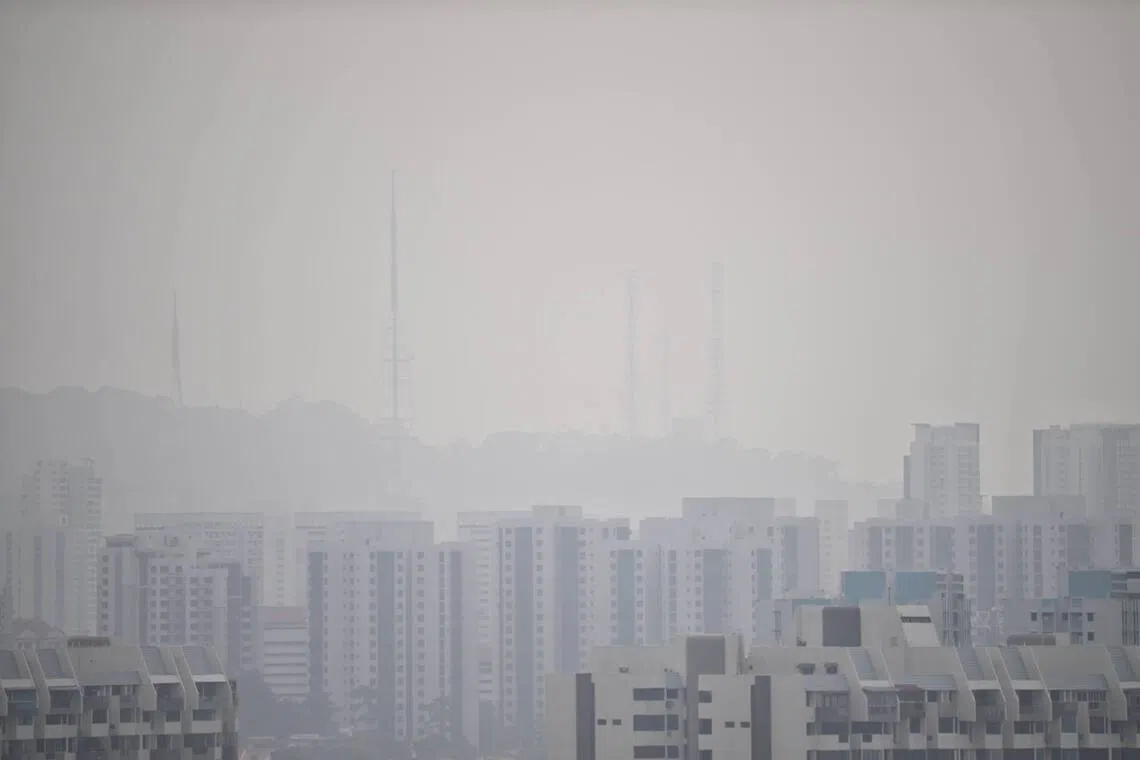
Bukit Timah Hill at around 9am on Sept 15. The PSI in Western Singapore as of 9.20am was in the unhealthy range of 124.
ST PHOTO: MARK CHEONG
Published Sep 15, 2026, 06:20 PM
Updated Sep 15, 2026, 06:20 PM
Singapore's central region has the worst air quality during the haze due to high urbanisation and stronger urban heat causing turbulent air that traps pollutants closer to the ground.
The haze particles from Indonesia mix with local emissions in dry conditions, increasing pollution levels in central Singapore compared to other regions.
Singapore's PSI differs from other AQI systems as it uses specialised equipment measuring six pollutants; comparisons with other indexes may show inconsistent air quality results.
SINGAPORE - Singapore has been experiencing hazy conditions for over a week since air quality in the central region first dipped to unhealthy levels on Sept 4.
Since then, the central region has consistently registered the highest Pollutant Standards Index (PSI) and PM2.5 readings across the five regions used for air quality monitoring - north, south, east, west and central.
The PSI is a measure of air quality in Singapore, and readings of over 100 reflect unhealthy air quality. Under such conditions, healthy people should reduce prolonged or strenuous outdoor activities, while those with chronic heart and lung disease should avoid such activities.
PM2.5 readings refer to concentrations of fine particulate matter that is the dominant pollutant during periods of transboundary haze.
For instance, the PSI in central Singapore reached a high of 154 in the central region at daybreak on Sept 15. Other regions registered readings of between 104 and 128 at that time.
At 5pm on the same day, the PSI in the central region dropped slightly to 133. The west and east region also recorded unhealthy air with the values between 114 and 116, while the PSI in the north and south dipped to moderate levels at 92 and 94 respectively.
The central region includes the Thomson, Marymount, Sin Ming, Ang Mo Kio, Bishan, Serangoon Gardens, MacRitchie and Toa Payoh areas, according to the website of the National Environment Agency.
Koh Tieh Yong, an adjunct associate professor in meteorology and climate science at NUS, told The Straits Times that this is because the area is highly urbanised and surrounded by more buildings.
Urban heat from concrete structures heat up the air above the ground, causing hot, rising air parcels that enhance air turbulence.
As winds carry the PM2.5 particles from the forest fires in Indonesia to Singapore, the pollutants are caught more efficiently by the turbulent air in the central region, causing them to concentrate over the area , and close to the ground, he added.
If thicker haze blows over Singapore, the whole island would reach unhealthy air quality or worse, added Koh.
This was seen on the morning of Sept 15, when all parts of Singapore registered unhealthy air – the first time this has occurred since 2019.
Hazy conditions seen from Tanjong Pagar Distripark towards Bukit Purmei and Mount Faber at 3.02pm on Sept 15. ST PHOTO: JASEL POH
Hazy conditions seen from Tanjong Pagar Distripark towards Bukit Purmei and Mount Faber at 3.02pm on Sept 15.
Steve Yim, professor and director of the Centre for Climate Change and Environmental Health at NTU, added that the higher PSI in central region could be because of the dry conditions in Singapore.
Under such dry conditions, the particl e s can be from both haze and local emissions or pollutants in the downtown area, he said.
Separately, the National Environment Agency (NEA) said in a Facebook post on Sept 15 that while Singapore has referenced the US Environmental Protection Agency’s Air Quality Index (AQI) system in computing its PSI , they are not identical.
It added: “There are no international guidelines on the computation of air quality index. Each country adopts a different index system based on local needs and circumstances.”
“ Air quality readings or indices provided by other websites adopt other methods of computing the index and are not comparable with the 24-hr PSI,” the agency said. “They may also rely on a combination of low-cost, less robust sensors and published data to make their calculations.”
For instance, local website IQAir uses data from NEA and seven private contributors to churn our the air quality index and PM2.5 value in Singapore.
NEA’s post comes as some social media users have been comparing Singapore’s PSI readings, with the AQI found on other websites such as aqicn.org .
The AQI readings often reflect poorer air quality in Singapore than the 24-hour PSI, which is Singapore’s official national reporting system for air quality.
The PSI is calculated based on six different pollutants - small particulate matter PM10 and PM2.5, sulphur dioxide, nitrogen dioxide, ozone and carbon monoxide.
The NEA said Singapore’s air quality data is measured by pollutant analysers, which continuously measure the level of the six pollutant types.
“These analysers, placed across the five regions of Singapore, are highly specialised equipment, based on internationally recognised methods,” NEA said. “This is to ensure measurements are reliable and scientifically robust.”
National Environment Agency
9月15日上午9点左右,武吉知马山。截至上午9点20分,新加坡西部地区的PSI指数为124,处于不健康范围。
《海峡时报》照片:张马克
发布于2026年9月15日下午6:20
更新于2026年9月15日下午6:20
由于高度城市化和更强烈的城市热浪导致空气湍流,使污染物滞留在更靠近地面的地方,新加坡中部地区在雾霾期间空气质量最差。
来自印度尼西亚的雾霾颗粒在干燥条件下与当地排放物混合,导致新加坡中部地区的污染水平比其他地区更高。
新加坡的PSI与其他AQI系统不同,因为它使用专门的设备测量六种污染物;与其他指数的比较可能会显示不一致的空气质量结果。
新加坡——自9月4日新加坡中部地区空气质量首次降至不健康水平以来,新加坡已经连续一周多处于雾霾天气中。
从那时起,中部地区的污染物标准指数 (PSI) 和 PM2.5 读数在用于空气质量监测的五个地区(北部、南部、东部、西部和中部)中一直保持最高水平。
新加坡空气质量指数(PSI)是衡量空气质量的指标,PSI读数超过100表示空气质量不健康。在这种情况下,健康人群应减少长时间或剧烈的户外活动,而患有慢性心脏和肺部疾病的人则应避免此类活动。
PM2.5读数指的是细颗粒物的浓度,细颗粒物是跨境雾霾期间的主要污染物。
例如,9 月 15 日清晨,新加坡中部地区的 PSI 指数达到 154 的高点。当时其他地区的读数在 104 到 128 之间。
当天下午 5 点,中部地区的空气污染指数略微下降至 133。西部和东部地区的空气污染指数也达到不健康水平,介于 114 和 116 之间,而北部和南部地区的空气污染指数分别降至 92 和 94,处于中等水平。
根据国家环境局网站的信息,中心区域包括汤申、玛丽蒙、信明、宏茂桥、碧山、实龙岗花园、麦里芝和Toa Payoh地区。
新加坡国立大学气象与气候科学系兼职副教授许铁勇告诉《海峡时报》,这是因为该地区高度城市化,周围有很多建筑物。
混凝土建筑产生的城市热量会加热地面以上的空气,导致热空气团上升,从而加剧空气湍流。
他补充说,当风将印度尼西亚森林火灾产生的 PM2.5 颗粒物吹向新加坡时,中部地区的湍流空气能更有效地捕获这些污染物,导致它们聚集在该地区上空,并靠近地面。
Koh补充说,如果更浓的雾霾吹过新加坡,整个岛屿的空气质量将达到不健康甚至更糟的程度。
9 月 15 日上午,新加坡全境空气质量均不达标,这是自 2019 年以来首次出现这种情况。
9月15日下午3点02分,从丹戎巴葛地区公园望向武吉布美和花柏山,可见雾霾天气。(海峡时报摄影:贾塞尔·波)
9月15日下午3点02分,从丹戎巴葛地区公园向武吉布美和花柏山方向望去,可见雾霾天气。
南洋理工大学气候变化与环境健康中心主任兼教授Steve Yim补充说,中部地区较高的PSI值可能是由于新加坡的干燥气候造成的。
他说,在这种干燥条件下,颗粒物可能来自雾霾,也可能来自市中心地区的本地排放物或污染物。
另外,国家环境局 (NEA) 在 9 月 15 日的 Facebook 帖子中表示,虽然新加坡在计算其 PSI 时参考了美国环境保护署的空气质量指数 (AQI) 系统,但两者并不完全相同。
报告还补充道:“目前尚无关于空气质量指数计算的国际准则。每个国家都根据当地的需求和情况采用不同的指数体系。”
该机构表示:“其他网站提供的空气质量读数或指数采用不同的计算方法,与24小时PSI指数不具可比性。它们可能还依赖于低成本、低可靠性的传感器和已发布的数据进行计算。”
例如,本地网站 IQAir 使用来自新加坡国家环境局 (NEA) 和七个私人捐助者的数据来计算新加坡的空气质量指数和 PM2.5 值。
NEA 的帖子发布之际,一些社交媒体用户正在将新加坡的 PSI 读数与 aqicn.org 等其他网站上的 AQI 进行比较。
新加坡的空气质量指数 (AQI) 读数通常反映出比 24 小时空气污染指数 (PSI) 更差的空气质量,而 24 小时空气污染指数是新加坡官方的国家空气质量报告系统。
PSI 是根据六种不同的污染物计算得出的——细颗粒物 PM10 和 PM2.5、二氧化硫、二氧化氮、臭氧和一氧化碳。
新加坡国家环境局表示,新加坡的空气质量数据是通过污染物分析仪测量的,这些分析仪会持续测量六种污染物的水平。
新加坡国家环境局表示:“这些分析仪分布在新加坡的五个区域,都是高度专业化的设备,采用国际公认的方法。这样做是为了确保测量结果可靠且科学严谨。”
国家环境局