Singapore adults are getting more active, but eating more calories and salt: MOH, HPB surveys新加坡成年人的运动量增加,但摄入的卡路里和盐分也更多:卫生部和保健促进局的调查
People are eating out more frequently, and this is one reason behind the increase in calorie, saturated fat and sodium intake.
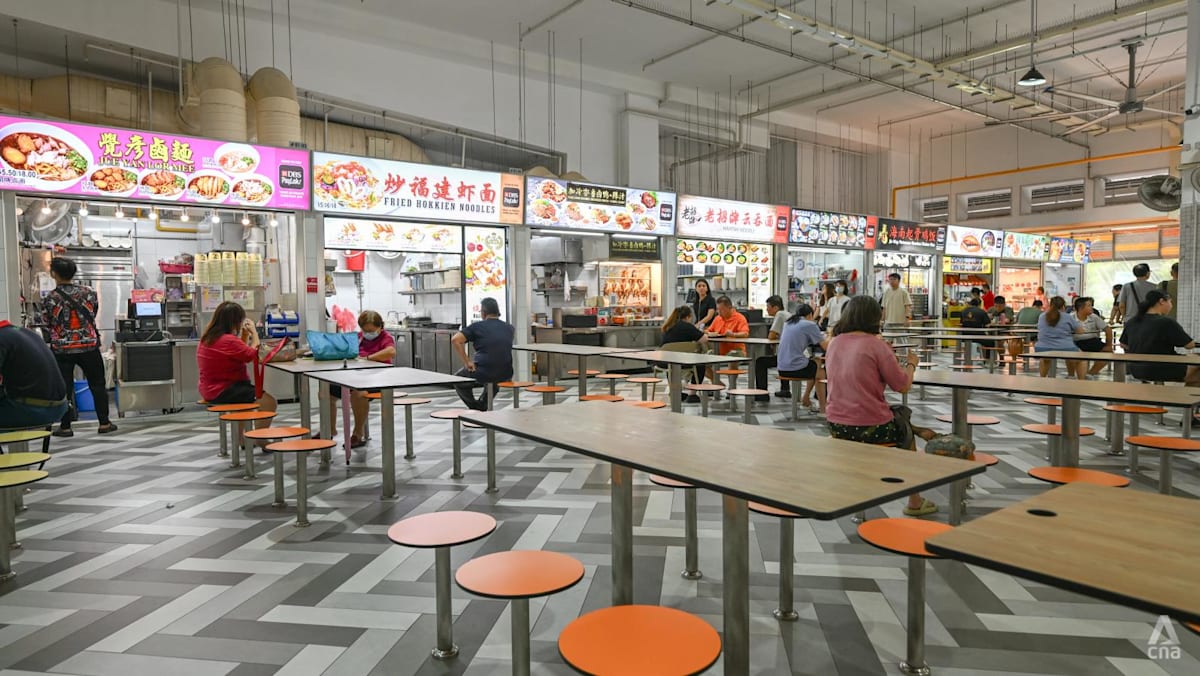
People are eating out more frequently, and this is one reason behind the increase in calorie, saturated fat and sodium intake.
Hawker centre at Harmony Village on Aug 20, 2025. (Photo: CNA/Tan Wen Lin)
This audio is generated by an AI tool.
SINGAPORE: Adults in Singapore are more physically active and consuming less sugar, but their calorie, fat and sodium intake has risen, according to national surveys released on Saturday (Oct 3).
The Ministry of Health (MOH) and Health Promotion Board (HPB) released findings from the National Population Health Survey and National Nutrition Survey.
The health survey, conducted from August 2024 to July 2025, tracked the health, risk factors and lifestyle practices of residents aged 18 to 74. The nutrition survey, conducted from June to December 2025, examined the dietary patterns and nutritional status of residents aged 18 to 69.
MORE CALORIES, FAT AND SALT
Average daily calorie intake rose from 2,360 in 2019 to 2,460 in 2025. More than half of Singapore residents, or 57 per cent, consumed more calories than their recommended daily energy requirements after accounting for their levels of physical activity.
CNA Games Guess Word Crack the word, one row at a time Buzzword Create words using the given letters Mini Sudoku Tiny puzzle, mighty brain teaser Mini Crossword Small grid, big challenge Word Search Spot as many words as you can Show More Show Less Younger adults aged 18 to 29 consumed the most calories, at an average of 2,655 a day. But the biggest increase was among those aged 30 to 49, whose average intake rose by 141 calories from 2019 to 2,576. Of this group, 63 per cent consumed more than they needed. Consumption of refined carbohydrates such as white rice and white bread increased, while total dietary fat intake rose from 94g in 2019 to 103g in 2025. Saturated fat accounted for 35 per cent of total fat intake, above the recommended limit of 30 per cent. Older adults, however, may not be getting enough protein. HPB advised seniors to aim for 20g to 25g of protein at each of their three meals, roughly the amount in a palm-sized piece of cooked lean meat, fish or poultry. Eggs, tofu and soy milk are other protein-rich options, and shoppers can look for packaged products labelled “higher in protein” or carrying the Healthier Choice symbol. Sodium intake also continued to climb, with average daily intake rising from 3,480mg in 2019 to 4,000mg in 2025. Nearly all Singapore residents, or 95 per cent, exceeded the recommended daily sodium limit of 2,000mg, equivalent to about one teaspoon of salt. This is up from 88 per cent in 2019. Among residents with the highest sodium intake, soupy dishes were the biggest source, contributing 358mg of sodium per 1,000 calories consumed. Processed foods followed at 266mg, while flavoured rice and noodle dishes and gravy- and sauce-based dishes each contributed 261mg. Stir-fried dishes contributed 198mg and bread, noodles and pasta 110mg. Together, these food categories accounted for around 80 per cent of sodium consumed by this group, according to HPB's analysis.
Younger adults aged 18 to 29 consumed the most calories, at an average of 2,655 a day. But the biggest increase was among those aged 30 to 49, whose average intake rose by 141 calories from 2019 to 2,576. Of this group, 63 per cent consumed more than they needed.
Consumption of refined carbohydrates such as white rice and white bread increased, while total dietary fat intake rose from 94g in 2019 to 103g in 2025. Saturated fat accounted for 35 per cent of total fat intake, above the recommended limit of 30 per cent.
Older adults, however, may not be getting enough protein. HPB advised seniors to aim for 20g to 25g of protein at each of their three meals, roughly the amount in a palm-sized piece of cooked lean meat, fish or poultry.
Eggs, tofu and soy milk are other protein-rich options, and shoppers can look for packaged products labelled “higher in protein” or carrying the Healthier Choice symbol.
Sodium intake also continued to climb, with average daily intake rising from 3,480mg in 2019 to 4,000mg in 2025.
Nearly all Singapore residents, or 95 per cent, exceeded the recommended daily sodium limit of 2,000mg, equivalent to about one teaspoon of salt. This is up from 88 per cent in 2019.
Among residents with the highest sodium intake, soupy dishes were the biggest source, contributing 358mg of sodium per 1,000 calories consumed. Processed foods followed at 266mg, while flavoured rice and noodle dishes and gravy- and sauce-based dishes each contributed 261mg. Stir-fried dishes contributed 198mg and bread, noodles and pasta 110mg.
Together, these food categories accounted for around 80 per cent of sodium consumed by this group, according to HPB's analysis.
EATING OUT MORE OFTEN
The findings pointed to eating out as a factor behind the rise in calorie, saturated fat and sodium intake. Seven in 10 residents ate out at least once a day in 2025, up from six in 10 in 2019. They ate out an average of nine times a week, compared with eight in 2019.
Adults aged 18 to 29 ate out most often, at a median of 10 times a week, with 78 per cent doing so at least once a day. Among those aged 30 to 49, the figure was 70 per cent.
Those who ate out two or more times a day consumed more calories, saturated fat and sodium than those who ate out six times a week or less.
An HPB analysis of 182 commonly consumed dishes found their calorie and sodium content rose between 2023 and 2025/2026. For example, a typical serving of chicken rice went from 557 to 646 calories, while nasi biryani climbed from 970 to 1,310.
Emerging popular dishes such as mala xiang guo and tomato hot pot also tended to be larger in portion and higher in calories, fat and sodium.
Asked at a media briefing why calories had risen, HPB said one possibility was that amid rising food costs, F&B operators may be increasing the proportion of refined carbohydrates while reducing more expensive protein.
However, it stressed that this was a hypothesis and yet to be verified.
HPB has been encouraging F&B operators to switch to lower-sodium ingredients, but officials said getting individual hawkers to change their recipes remains a challenge given the fragmented nature of the sector.
About 14 per cent of the 4,000 hawkers reached through the Healthy Ingredient Promotion Programme switched to lower-sodium sauces and seasonings, HPB said.
About 3,000 F&B establishments used lower-sodium salt, sauces or seasonings in 2025, up sixfold from 500 in 2022. These include hawker and coffee shop stalls, restaurants, canteens and caterers.
HPB said it would step up engagement with F&B operators through initiatives such as the Healthier Dining Programme and the "Less Salt, More Taste" movement.
This includes working with central kitchens and mass-market operators such as hawker centres, coffee shops and food courts to encourage the use of healthier and lower-sodium ingredients and less salt, sauces and seasonings.
MOH will also extend mandatory Nutri-Grade labelling and advertising restrictions beyond beverages by 2028, covering key sources of sodium and saturated fat. These include pre-packed salt, sauces, seasonings, instant noodles and cooking oil.
SUGAR INTAKE CONTINUES TO FALL
Daily total sugar intake fell from 60g in 2018 to 48g in 2025, with the drop particularly pronounced for sugar-sweetened drinks.
The proportion of residents keeping within the recommended limit of no more than 10 per cent of daily energy intake rose from 61 per cent in 2019 to 79 per cent in 2025.
MOH and HPB said the improvement was in line with falling median sugar levels in beverages.
For pre-packaged drinks, the median fell from 7.1 per cent in 2017 to 4.6 per cent in 2024, while freshly prepared beverages dropped from 7.5 per cent in 2020 to 4.1 per cent in 2025.
MORE STAYING ACTIVE, GOING FOR SCREENING
The proportion of residents getting sufficient total physical activity rose from 84.7 per cent in 2024 to 87.3 per cent in 2025. However, only 37.6 per cent did sufficient muscle-strengthening activities, a figure that has stayed stable since 2020.
Participation in health screening for chronic diseases and cancers also increased.
MOH and HPB said the figures were early signs that Healthier SG was supporting health-seeking behaviour and the early detection and diagnosis of disease. The scheme, launched in July 2023, has residents work with family doctors on personalised health plans.
Daily smoking and poor mental health remained broadly stable.
MOH and HPB said the latest findings showed that residents were adopting healthier lifestyles, but stressed the need to improve overall diet quality.
“Having a healthy diet, increasing physical activity, managing stress and ceasing smoking all have a direct impact on reducing the risk of chronic diseases and other health risks,” they said.
They added that regular health screenings and follow-ups were important for early detection and intervention.
Get our pick of top stories and thought-provoking articles in your inbox
Stay updated with notifications for breaking news and our best stories
Join our channel for the top reads for the day on your preferred chat app
人们外出就餐的频率越来越高,这也是导致卡路里、饱和脂肪和钠摄入量增加的原因之一。
2025年8月20日,和谐村小贩中心。(图片:CNA/陈文琳)
这段音频由人工智能工具生成。
新加坡:根据周六(10 月 3 日)公布的全国调查,新加坡成年人的身体活动量增加,糖的摄入量减少,但他们的卡路里、脂肪和钠的摄入量却增加了。
卫生部和健康促进局公布了全国人口健康调查和全国营养调查的结果。
这项健康调查于 2024 年 8 月至 2025 年 7 月进行,追踪了 18 至 74 岁居民的健康状况、风险因素和生活方式习惯。这项营养调查于 2025 年 6 月至 12 月进行,调查了 18 至 69 岁居民的饮食模式和营养状况。
更高的卡路里、脂肪和盐分
新加坡居民平均每日卡路里摄入量从 2019 年的 2360 卡路里增加到 2025 年的 2460 卡路里。超过一半的新加坡居民(57%)在考虑了他们的身体活动水平后,摄入的卡路里超过了他们建议的每日能量需求。
CNA游戏猜词游戏:逐行破解单词;流行词游戏:用给定的字母组成单词;迷你数独:小巧的谜题,强大的脑力挑战;迷你填字游戏:小方格,大挑战;单词搜索:尽可能多地找出单词。显示更多 显示更少 18至29岁的年轻人摄入的热量最多,平均每天2655卡路里。但增幅最大的是30至49岁的人群,他们的平均摄入量从2019年的2019年增加了141卡路里,达到2576卡路里。在这个群体中,63%的人摄入的热量超过了所需。精制碳水化合物(如白米饭和白面包)的摄入量有所增加,而膳食总脂肪摄入量从2019年的94克增加到2025年的103克。饱和脂肪占总脂肪摄入量的35%,高于30%的推荐上限。然而,老年人可能蛋白质摄入不足。新加坡保健促进局建议老年人在一日三餐中每餐摄入20至25克蛋白质,这大约相当于一块手掌大小的熟瘦肉、鱼或禽肉的蛋白质含量。鸡蛋、豆腐和豆浆也是富含蛋白质的选择,消费者可以寻找标有“高蛋白”或带有“健康之选”标志的包装产品。钠摄入量也持续攀升,平均每日摄入量从2019年的3480毫克增加到2025年的4000毫克。几乎所有新加坡居民(95%)的钠摄入量都超过了每日推荐摄入量2000毫克(约一茶匙盐)的上限。这一比例高于2019年的88%。在钠摄入量最高的居民中,汤类菜肴是最大的钠来源,每摄入1000卡路里汤类菜肴就会摄入358毫克钠。加工食品的钠含量位居第二,为266毫克;调味米饭和面条以及肉汁和酱汁类菜肴的钠含量均为261毫克;炒菜的钠含量为198毫克;面包、面条和意大利面的钠含量为110毫克。根据新加坡保健促进局(HPB)的分析,这些食物类别合计约占该人群钠摄入量的80%。
18至29岁的年轻人摄入的热量最多,平均每天2655卡路里。但增幅最大的是30至49岁的人群,他们的平均摄入量从2019年的2019年增加了141卡路里,达到2576卡路里。在这个群体中,63%的人摄入的热量超过了自身所需。
精制碳水化合物(如白米饭和白面包)的消费量增加,而膳食脂肪总摄入量从 2019 年的 94 克增加到 2025 年的 103 克。饱和脂肪占总脂肪摄入量的 35%,超过了 30% 的推荐限值。
然而,老年人可能摄入的蛋白质不足。新加坡保健促进局建议老年人在一日三餐中每餐摄入20克至25克蛋白质,这大约相当于一块手掌大小的熟瘦肉、鱼或禽肉的蛋白质含量。
鸡蛋、豆腐和豆浆也是富含蛋白质的选择,消费者可以寻找包装上标有“高蛋白”或带有“健康之选”标志的产品。
钠的摄入量也持续攀升,平均每日摄入量从 2019 年的 3480 毫克增加到 2025 年的 4000 毫克。
几乎所有新加坡居民(95%)的钠摄入量都超过了每日建议摄入量2000毫克(约一茶匙盐)的上限。这一比例高于2019年的88%。
在钠摄入量最高的居民中,汤类菜肴是最大的钠来源,每摄入1000卡路里热量,钠含量高达358毫克。加工食品紧随其后,钠含量为266毫克;调味米饭和面条以及肉汁和酱汁类菜肴的钠含量均为261毫克;炒菜的钠含量为198毫克;面包、面条和意大利面的钠含量为110毫克。
根据HPB的分析,这些食物类别加起来约占该群体钠摄入量的80%。
更频繁地外出就餐
研究结果表明,外出就餐是导致卡路里、饱和脂肪和钠摄入量增加的因素之一。到2025年,十分之七的居民每天至少外出就餐一次,高于2019年的十分之六。他们平均每周外出就餐九次,而2019年为八次。
18至29岁的成年人外出就餐最为频繁,平均每周10次,其中78%的人每天至少外出就餐一次。30至49岁的人群中,这一比例为70%。
每天外出就餐两次或两次以上的人比每周外出就餐六次或六次以下的人摄入更多的卡路里、饱和脂肪和钠。
新加坡保健促进局 (HPB) 对 182 道常见菜肴的分析发现,2023 年至 2025/2026 年间,这些菜肴的卡路里和钠含量均有所上升。例如,一份典型的鸡饭的卡路里从 557 增加到 646,而印度香饭的卡路里则从 970 增加到 1310。
麻辣香锅、番茄火锅等新兴流行菜肴的份量也往往更大,热量、脂肪和钠含量也更高。
在一次媒体简报会上,当被问及为什么卡路里含量上升时,HPB表示,一种可能性是,在食品成本上涨的情况下,餐饮经营者可能增加了精制碳水化合物的比例,同时减少了价格更高的蛋白质。
然而,报告强调这只是一个假设,尚待验证。
新加坡保健促进局 (HPB) 一直鼓励餐饮经营者改用低钠食材,但官员表示,鉴于该行业的分散性,让个体小贩改变配方仍然是一个挑战。
新加坡保健促进局表示,通过健康食材推广计划接触到的 4000 名小贩中,约有 14% 的人改用低钠酱料和调味料。
预计到 2025 年,将有约 3,000 家餐饮企业使用低钠盐、酱料或调味料,比 2022 年的 500 家增长六倍。这些企业包括小贩摊位、咖啡店摊位、餐厅、食堂和餐饮服务商。
保健促进局表示,将通过“健康餐饮计划”和“少盐多味”运动等举措,加强与餐饮经营者的合作。
这包括与中央厨房和大众市场运营商(如小贩中心、咖啡店和美食广场)合作,鼓励使用更健康、低钠的食材,并减少盐、酱汁和调味料的使用。
卫生部还将于2028年前把强制性营养等级标签和广告限制的范围扩大到饮料以外的其他食品,涵盖钠和饱和脂肪的主要来源,包括预包装盐、酱料、调味料、方便面和食用油。
糖摄入量持续下降
每日总糖摄入量从 2018 年的 60 克下降到 2025 年的 48 克,含糖饮料的下降幅度尤其明显。
2019 年至 2025 年间,将每日能量摄入量控制在推荐限值(不超过每日能量摄入量的 10%)内的居民比例从 61% 上升至 79%。
卫生部和保健促进局表示,这一改善与饮料中糖分含量中位数的下降趋势一致。
预包装饮料的中位数从 2017 年的 7.1% 下降到 2024 年的 4.6%,而新鲜制备的饮料的中位数从 2020 年的 7.5% 下降到 2025 年的 4.1%。
保持活跃,积极接受筛查
2024 年至 2025 年,达到足够总体力运动量的居民比例从 84.7% 上升至 87.3%。然而,只有 37.6% 的居民进行了足够的肌肉强化活动,这一数字自 2020 年以来一直保持稳定。
参与慢性病和癌症健康筛查的人数也有所增加。
卫生部和保健促进局表示,这些数据初步表明“健康新加坡”计划正在促进居民养成积极的健康习惯,并有助于疾病的早期发现和诊断。该计划于2023年7月启动,旨在让居民与家庭医生共同制定个性化的健康计划。
每日吸烟和心理健康状况不佳的情况总体上保持稳定。
卫生部和保健促进局表示,最新调查结果显示,居民们正在采取更健康的生活方式,但强调需要提高整体饮食质量。
他们说:“保持健康的饮食习惯、增加体育锻炼、管理压力和戒烟都能直接降低患慢性病和其他健康风险的风险。”
他们还补充说,定期健康筛查和后续随访对于早期发现和干预至关重要。
订阅我们的邮件,即可获取精选热点新闻和引人深思的文章。
订阅通知,第一时间获取突发新闻和精彩报道。
加入我们的频道,即可在您常用的聊天应用上获取当日热门文章。