CNA Explains: Why PSI and AQI readings differ - and which one should you follow during haze season?CNA 解释:为什么 PSI 和 AQI 读数不同——在雾霾季节应该以哪个为准?
While the National Environment Agency uses the 24-hour PSI and 1-hour PM2.5 to track air quality, other online platforms monitor pollution levels differently.
While the National Environment Agency uses the 24-hour PSI and 1-hour PM2.5 to track air quality, other online platforms monitor pollution levels differently.
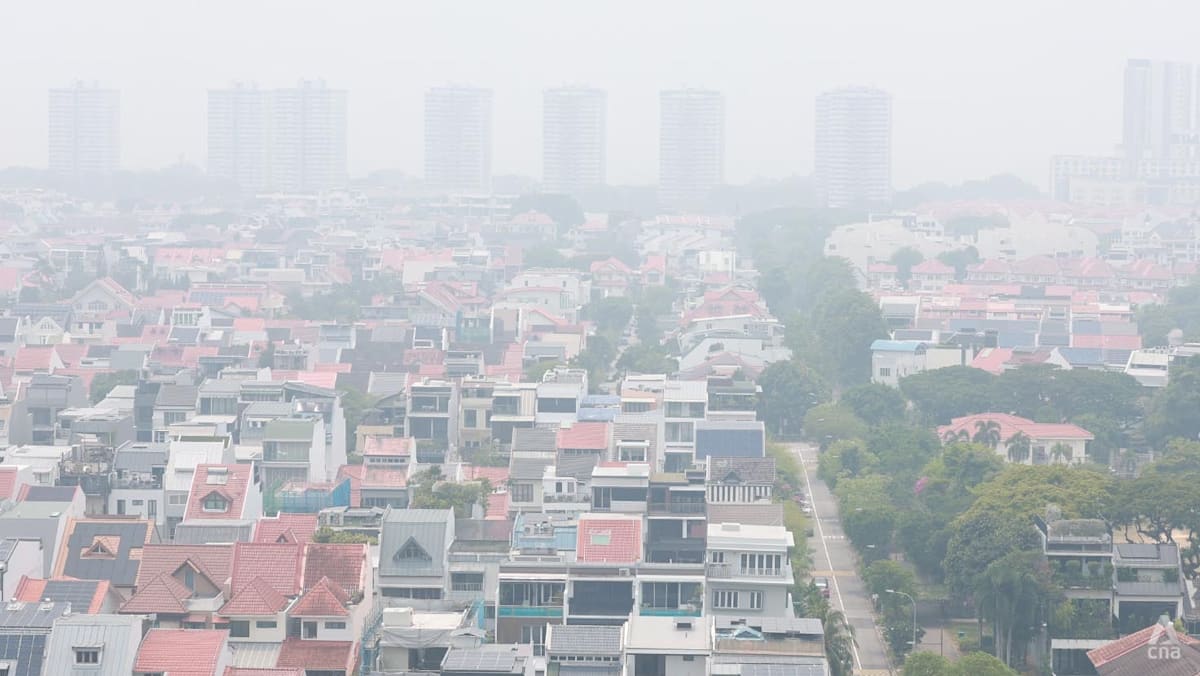
Haze seen from Chai Chee, Singapore, at around 12.30pm on Oct 9, 2026. (Photo: CNA/Raj Nadarajan)
This audio is generated by an AI tool.
SINGAPORE: As hazy conditions persist in Singapore, monitoring air quality has likely become more routine for residents, organisations and institutions.
The country announced on Friday (Oct 9) several measures it would take and consider, such as distributing N95 masks and closing schools, if the 24-hour Pollutant Standards Index (PSI) hits certain levels.
The National Environment Agency (NEA) provides two key indicators for Singapore’s air quality - the 24-hour PSI and the 1-hour PM 2.5 reading.
But a quick search online will turn up other figures as well.
CNA Games Guess Word Crack the word, one row at a time Buzzword Create words using the given letters Mini Sudoku Tiny puzzle, mighty brain teaser Mini Crossword Small grid, big challenge Word Search Spot as many words as you can Show More Show Less Last week, several international news outlets reported that Singapore topped IQAir's live ranking of the world's most polluted major cities. The Swiss air quality monitoring platform tracks pollution levels using a modified version of the US Air Quality Index (AQI), known as US AQI+, rather than Singapore’s PSI or PM2.5 readings. It applies US AQI breakpoints, which mark the boundaries between air quality categories, to hourly pollutant measurements. So why do these readings differ, and which ones should people in Singapore pay attention to?
Last week, several international news outlets reported that Singapore topped IQAir's live ranking of the world's most polluted major cities.
The Swiss air quality monitoring platform tracks pollution levels using a modified version of the US Air Quality Index (AQI), known as US AQI+, rather than Singapore’s PSI or PM2.5 readings.
It applies US AQI breakpoints, which mark the boundaries between air quality categories, to hourly pollutant measurements.
So why do these readings differ, and which ones should people in Singapore pay attention to?
The haze seen at Orchard Road on Oct 12, 2026. (Photo: CNA/Marcus Mark Ramos)
What do the different air quality indicators mean?
The AQI is a general system that considers up to six main pollutants: PM2.5, PM10, carbon monoxide, sulfur dioxide, nitrogen dioxide and ground-level ozone.
According to IQAir’s website, AQI is calculated differently around the world, with China and the US having the two most widely used systems.
The AQI and Singapore’s PSI follow a similar calculation process, said Professor Steve Yim, director of the Centre for Climate Change and Environmental Health at Nanyang Technological University.
Pollutant concentrations are averaged over specified running periods and converted into sub-index values. The highest sub-index among the pollutants considered then determines the overall index value.
Singapore’s PSI, for example, takes into account six pollutants: PM2.5, PM10, sulphur dioxide, carbon monoxide, ozone and nitrogen dioxide.
If PM2.5 has a sub-index of 150 and that is the highest value among the pollutants, the overall PSI reading will be 150.
During haze episodes in Singapore, the dominant pollutant is usually PM2.5, which refers to fine particulate matter measuring 2.5 micrometres or less in diameter.
The main difference between the indexes lies in the thresholds used for their various air quality categories, said Prof Yim.
For example, he noted that under AQI, air quality is considered unhealthy when PM2.5, as the dominant pollutant, falls between 55.5 µg/m3 and 125.4 µg/m3. Under the PSI, the unhealthy range is 56µg/m3 to 150 µg/m3.
“These ranges for determining AQI categories are set by governments according to their situation,” said Prof Yim.
“So, it should be noted that the index from other countries may not be applicable directly to a country.”
Countries also split their index bands differently, said Associate Professor Liya E Yu from the National University of Singapore’s (NUS) Department of Civil and Environmental Engineering.
For example, she noted that the US AQI is a six-band system as it devotes a specific band to "Unhealthy for Sensitive Groups".
There is no equivalent band in Singapore’s PSI system or Malaysia’s Air Pollutant Index.
Singapore's PSI, however, provides separate health advisories for different population groups, including children, older people and those with chronic heart or lung conditions.
Singapore's PSI, the AQI and Malaysia's API serve the same general purpose - to communicate air pollution levels and their potential health implications to the public, said Provost’s Chair Professor Rajasekhar Balasubramanian from NUS’ Department of Civil and Environmental Engineering.
But since they differ in calculation methods, concentration breakpoints for each air pollutant, and health categories, their values should not be compared directly without accounting for these methodological differences, he added.
Dr Yu similarly advised against comparing figures from different systems as it would lead to confusion.
Instead, people should focus on the health advisories or air quality descriptions that accompany each system’s grading framework to get guidance on activities and plans amid air quality conditions, he said.
People waiting for bus with masks on at a bus stop in Boon Lay on Oct 12, 2026. (Photo: CNA/Raydza Rahman)
Should Singapore residents pay attention to the AQI on other sites?
IQAir, which uses US AQI categories and breakpoints, told CNA that it provides air quality data across more than 140 countries to give users a consistent index for comparing conditions across cities and nations.
The platform said its approach was not intended to replace national standards or suggest that every country should use the same regulatory system.
“Rather, it offers a common, health-focused reference for a world in which air pollution is measured and communicated in many different ways,” said the platform.
According to IQAir, it derives its Singapore readings by combining measurements from government monitoring stations with validated non-government sensors operated by private citizens, businesses, nonprofits and schools.
IQAir said this “community-powered network” allows it to provide more geographically detailed observations, although experts caution that readings from non-government sources could use lower-cost sensors whose readings may not always be directly comparable with those from government monitoring stations.
IQAir said Singapore’s PSI framework was last substantially revised in April 2014, when PM2.5 was incorporated into the index.
The US Environmental Protection Agency system, which IQAir uses, updated its AQI thresholds for PM2.5 in May 2024 to reflect updated health evidence and strengthen public-health protection, the platform said.
“This means Singapore’s core PSI framework is more than a decade old, while the US AQI has undergone a more recent update,” said IQAir.
Besides the 24-hour PSI, Singapore also publishes 1-hour PM2.5 readings to reflect current air quality.
Experts told CNA that NEA’s readings were a reliable and accurate source of air quality measurements.
Prof Balasubramanian advised Singapore residents to use NEA’s figures as the primary reference for official local information.
“An online site may display a precise-looking AQI number without necessarily providing a more accurate picture of local air quality,” he explained.
“Reliability depends on where its measurements come from, how frequently they are updated, which pollutants and averaging periods it uses, and whether it reports actual measurements or model-based estimates.”
Prof Yim also cautioned that the AQI readings on some websites could be based on data from low-cost and community air quality sensors.
He advised readers to be careful when considering AQI readings on websites which showed air pollutant concentration levels that differed significantly from those listed on NEA’s website.
Even after validation, such data might not be comparable to those from government networks due to possible inconsistencies, including data accuracy, sensor reliability and measurement locations, he said.
The professor acknowledged that there was room for improvement in the PSI values and how the data was reported for better communication.
But the current NEA readings are “relatively reliable and accurate” references, he said.
NEA told CNA that it uses highly specialised analysers to monitor Singapore’s air quality and its equipment follows “internationally recognised measurement methods for reliable and scientifically robust measurements”.
The 24-hour PSI reflects air quality in line with 24-hour air quality indices in the US, EU and the United Kingdom, it said.
The agency advised users to refer to its official readings online and on the myENV app for accurate information on Singapore’s air quality.
Have any websites been flagged for inaccurate data before?
Third-party platforms may use different data sources, averaging periods, index categories and calculation methods to derive their AQI, NEA told CNA.
In 2019, the agency warned against comparing its 24-hour PSI readings with AQI readings on air quality website Aqicn.
This came after a growing number of online users referred to alternative air quality readings. In some cases, the websites reported readings that seemed to indicate that Singapore’s air quality was poorer than what NEA suggested for the same period.
NEA said at the time that Aqicn used an incorrect PM2.5 reading to derive its final AQI figures, as its calculations were based on the 1-hour PM2.5 reading instead of the 24-hour PM2.5 reading, which the US EPA recommends.
Asked for an update on the reliability of the website, which is still operating, NEA said Aqicn applies US AQI thresholds, meant for 24-hour data, to 1-hour PM2.5 levels.
The website also relies on a combination of data measured from low-cost, less robust sensors and published NEA data for its calculations, it added.
“Readings by such third-party platforms are therefore not directly comparable with NEA’s PSI.”
The website did not respond to CNA’s questions about whether it has updated its methodology.
According to a notice on the site, its air quality data is unvalidated at the time of publication and may be amended, without notice, at any time.
How should readers use NEA’s readings?
NEA’s 24-hour PSI and 1-hour PM 2.5 readings serve complementary purposes.
“The 24-hour PSI provides a stable indicator of overall pollution exposure, while the 1-hour PM2.5 concentration reflects a more responsive indication of short-term changes,” said Prof Balasubramanian.
Because it reflects pollution over a longer period, the 24-hour PSI may not immediately reflect short-lived pollution peaks that could be important for certain individuals.
This is where the hourly PM2.5 readings can help.
“The 1-hour PM2.5 concentration responds rapidly to changes in smoke haze plume transport, wind direction, atmospheric mixing and emissions along the smoke plume trajectory,” said Prof Balasubramanian.
It can therefore help people make immediate decisions, such as whether to exercise outdoors during a haze episode, he said.
But people should be mindful that a single hourly reading may not represent the pollution exposure accumulated over an entire day, he added.
Want an issue or topic explained? Email us at digitalnews [at] mediacorp.com.sg . Your question might become a story on our site.
Get our pick of top stories and thought-provoking articles in your inbox
Stay updated with notifications for breaking news and our best stories
Join our channel for the top reads for the day on your preferred chat app
虽然国家环境局使用 24 小时 PSI 和 1 小时 PM2.5 来跟踪空气质量,但其他在线平台以不同的方式监测污染水平。
2026年10月9日下午12点30分左右,新加坡柴智(Chai Chee)地区拍摄到的雾霾照片。(图片:CNA/Raj Nadarajan)
这段音频由人工智能工具生成。
新加坡:由于新加坡雾霾天气持续,监测空气质量可能已成为居民、组织和机构的日常工作。
该国于周五(10 月 9 日)宣布了几项措施,如果 24 小时污染物标准指数 (PSI) 达到一定水平,将采取和考虑这些措施,例如分发 N95 口罩和关闭学校。
新加坡国家环境局 (NEA) 提供了两个衡量新加坡空气质量的关键指标——24 小时 PSI 值和 1 小时 PM2.5 读数。
但只要在网上快速搜索一下,就会发现还有其他数据。
CNA游戏 猜词游戏 逐行破解单词 流行词游戏 用给定的字母组成单词 迷你数独 小谜题,脑力挑战 迷你填字游戏 小方格,大挑战 单词搜索 尽可能多地找出单词 显示更多 显示更少 上周,多家国际新闻媒体报道称,新加坡在IQAir发布的全球污染最严重主要城市实时排名中位居榜首。这家瑞士空气质量监测平台使用改良版的美国空气质量指数(AQI)——美国AQI+——来追踪污染水平,而不是新加坡的PSI或PM2.5读数。它将美国AQI的临界值(标志着空气质量类别之间的界限)应用于每小时的污染物测量值。那么,为什么这些读数会有所不同?新加坡人应该关注哪些读数呢?
上周,多家国际新闻媒体报道称,新加坡在 IQAir 发布的全球污染最严重主要城市实时排名中位居榜首。
瑞士空气质量监测平台使用美国空气质量指数 (AQI) 的改进版本(称为美国 AQI+)来跟踪污染水平,而不是使用新加坡的 PSI 或 PM2.5 读数。
它将美国空气质量指数 (AQI) 的临界值(标志着空气质量类别之间的界限)应用于每小时污染物测量。
那么,这些读数为何会有所不同?新加坡人又应该关注哪些读数呢?
2026年10月12日,乌节路出现雾霾。(图片:CNA/Marcus Mark Ramos)
不同的空气质量指标分别代表什么意思?
空气质量指数 (AQI) 是一个综合系统,它考虑了多达六种主要污染物:PM2.5、PM10、一氧化碳、二氧化硫、二氧化氮和地面臭氧。
根据 IQAir 网站的信息,世界各地的空气质量指数 (AQI) 计算方法各不相同,其中中国和美国拥有最广泛使用的两种计算系统。
南洋理工大学气候变化与环境健康中心主任Steve Yim教授表示,空气质量指数(AQI)和新加坡的空气污染指数(PSI)遵循类似的计算过程。
将污染物浓度在特定运行周期内取平均值,并转化为子指数值。然后,取所考虑污染物中最高的子指数值作为总指数值。
例如,新加坡的空气污染指数 (PSI) 考虑了六种污染物:PM2.5、PM10、二氧化硫、一氧化碳、臭氧和二氧化氮。
如果 PM2.5 的子指数为 150,并且是污染物中的最高值,则总 PSI 读数将为 150。
在新加坡发生雾霾天气时,主要污染物通常是 PM2.5,即直径为 2.5 微米或更小的细颗粒物。
Yim教授表示,这些指数之间的主要区别在于它们对各种空气质量类别所使用的阈值。
例如,他指出,根据空气质量指数(AQI),当主要污染物PM2.5浓度介于55.5 µg/m3至125.4 µg/m3之间时,空气质量被认为是不健康的。根据空气污染指数(PSI),不健康的范围是56 µg/m3至150 µg/m3。
“这些用于确定空气质量指数等级的范围是由各国政府根据自身情况设定的,”Yim教授说。
“因此,需要注意的是,其他国家的指数可能无法直接应用于某个国家。”
新加坡国立大学土木与环境工程系副教授李雅宇表示,各国划分指数区间的方式也各不相同。
例如,她指出,美国空气质量指数是一个六级系统,因为它专门设立了一个“对敏感人群不健康”的等级。
新加坡的PSI系统或马来西亚的空气污染指数中没有对应的等级。
然而,新加坡的PSI针对不同的人群提供不同的健康建议,包括儿童、老年人和患有慢性心脏或肺部疾病的人。
新加坡的PSI、AQI和马来西亚的API具有相同的总体目的——向公众传达空气污染水平及其对健康的潜在影响,新加坡国立大学土木与环境工程系教务长讲席教授Rajasekhar Balasubramanian表示。
但他补充说,由于它们的计算方法、每种空气污染物的浓度临界点和健康类别各不相同,因此在不考虑这些方法上的差异的情况下,不应直接比较它们的值。
余博士也建议不要比较不同系统的数据,因为这会导致混乱。
他表示,人们应该关注每个系统评级框架附带的健康建议或空气质量描述,以便获得在空气质量条件下开展活动和制定计划的指导。
2026年10月12日,在文礼的一个公交车站,人们戴着口罩等车。(图片:CNA/Raydza Rahman)
新加坡居民是否应该关注其他网站上的空气质量指数(AQI)?
IQAir 使用美国空气质量指数 (AQI) 分类和临界值,并告诉中央社,它提供 140 多个国家的空气质量数据,为用户提供一致的指数,以便比较不同城市和国家的空气质量状况。
该平台表示,其做法并非旨在取代国家标准,也不暗示每个国家都应该使用相同的监管体系。
该平台表示:“相反,它为空气污染的测量和传播方式多种多样的世界提供了一个以健康为中心的通用参考标准。”
据 IQAir 称,其新加坡读数是通过将政府监测站的测量数据与由私人公民、企业、非营利组织和学校运营的经过验证的非政府传感器的测量数据相结合而得出的。
IQAir 表示,这种“社区驱动的网络”使其能够提供更详细的地理观测数据,但专家警告说,来自非政府来源的读数可能使用成本较低的传感器,其读数可能并不总是与政府监测站的读数直接可比。
IQAir表示,新加坡的PSI框架上次进行重大修订是在2014年4月,当时PM2.5被纳入该指数。
IQAir平台表示,其使用的美国环境保护署系统已于2024年5月更新了PM2.5的空气质量指数阈值,以反映最新的健康证据并加强对公众健康的保护。
“这意味着新加坡的核心PSI框架已有十多年历史,而美国的AQI则进行了更新,”IQAir表示。
除了 24 小时 PSI 值外,新加坡还会发布 1 小时 PM2.5 读数,以反映当前的空气质量。
专家告诉亚洲新闻台,国家环境局的读数是可靠、准确的空气质量测量来源。
巴拉苏布拉马尼亚教授建议新加坡居民将国家环境局的数据作为官方本地信息的主要参考依据。
他解释说:“一个在线网站可能会显示一个看起来很精确的空气质量指数(AQI)数值,但并不一定能提供当地空气质量的更准确信息。”
“可靠性取决于其测量数据的来源、更新频率、使用的污染物和平均周期,以及报告的是实际测量值还是基于模型的估计值。”
Yim教授还提醒说,一些网站上的空气质量指数读数可能基于低成本和社区空气质量传感器的数据。
他建议读者在参考某些网站上的空气质量指数读数时要谨慎,因为这些网站上显示的空气污染物浓度水平与国家环境局网站上列出的水平存在显著差异。
他表示,即使经过验证,由于数据准确性、传感器可靠性和测量位置等可能存在的不一致之处,此类数据也可能无法与政府网络的数据相提并论。
教授承认,PSI 值以及数据报告方式还有改进的空间,以便更好地进行沟通。
但他表示,目前国家环境局的读数是“相对可靠和准确的”参考值。
新加坡国家环境局告诉亚洲新闻台,它使用高度专业化的分析仪来监测新加坡的空气质量,其设备遵循“国际公认的测量方法,以进行可靠且科学严谨的测量”。
报告称,24 小时 PSI 反映的空气质量与美国、欧盟和英国的 24 小时空气质量指数一致。
该机构建议用户参考其官网和 myENV 应用程序上的官方读数,以获取有关新加坡空气质量的准确信息。
之前是否有网站因数据不准确而被标记过?
国家环境局告诉亚洲新闻台,第三方平台可能会使用不同的数据源、平均周期、指数类别和计算方法来得出其空气质量指数。
2019 年,该机构警告不要将其 24 小时 PSI 读数与空气质量网站 Aqicn 上的 AQI 读数进行比较。
此前,越来越多的网民开始参考其他空气质量读数。在某些情况下,这些网站报告的读数似乎表明,新加坡同期空气质量比国家环境局(NEA)公布的数据更差。
当时,NEA 表示,Aqicn 使用了错误的 PM2.5 读数来得出其最终的 AQI 数据,因为它的计算是基于 1 小时 PM2.5 读数,而不是美国环保署建议的 24 小时 PM2.5 读数。
当被问及该网站(目前仍在运行)的可靠性更新时,NEA 表示,Aqicn 将美国空气质量指数(AQI)阈值(适用于 24 小时数据)应用于 1 小时 PM2.5 水平。
该网站还补充说,其计算依赖于低成本、不太可靠的传感器测量的数据和已发布的NEA数据的组合。
“因此,此类第三方平台的读数与NEA的PSI不具有直接可比性。”
该网站没有回应 CNA 关于其方法论是否已更新的问题。
根据网站上的通知,其空气质量数据在发布时未经验证,并且可能随时进行修改,恕不另行通知。
读者应该如何使用NEA的阅读材料?
NEA 的 24 小时 PSI 和 1 小时 PM2.5 读数具有互补作用。
巴拉苏布拉马尼亚教授表示:“24 小时 PSI 指数能够稳定反映整体污染暴露情况,而 1 小时 PM2.5 浓度则能更灵敏地反映短期变化。”
由于 24 小时 PSI 反映的是较长时间内的污染情况,因此它可能无法立即反映出对某些人来说可能很重要的短暂污染高峰。
这时,每小时的 PM2.5 读数就能派上用场了。
“1 小时 PM2.5 浓度对烟霾羽流输送、风向、大气混合以及沿烟霾羽流轨迹的排放变化反应迅速,”巴拉苏布拉马尼亚教授说。
他说,因此它可以帮助人们立即做出决定,例如在雾霾期间是否进行户外运动。
但他补充说,人们应该注意,每小时的读数可能无法代表一整天累积的污染暴露量。
想了解某个问题或话题?请发送邮件至 digitalnews [at] mediacorp.com.sg。您的提问可能会成为我们网站上的报道内容。
订阅我们的邮件,即可获取精选热点新闻和引人深思的文章。
订阅通知,第一时间获取突发新闻和精彩报道。
加入我们的频道,即可在您常用的聊天应用上获取当日热门文章。