Singapore Q2 tourism receipts down 6.2% at $7.21 billion amid global uncertainty受全球经济不确定性影响,新加坡第二季度旅游收入下降6.2%至72.1亿美元。
Tourism receipts for the first half of 2026 stood at $15.71 billion. Read more at straitstimes.com.
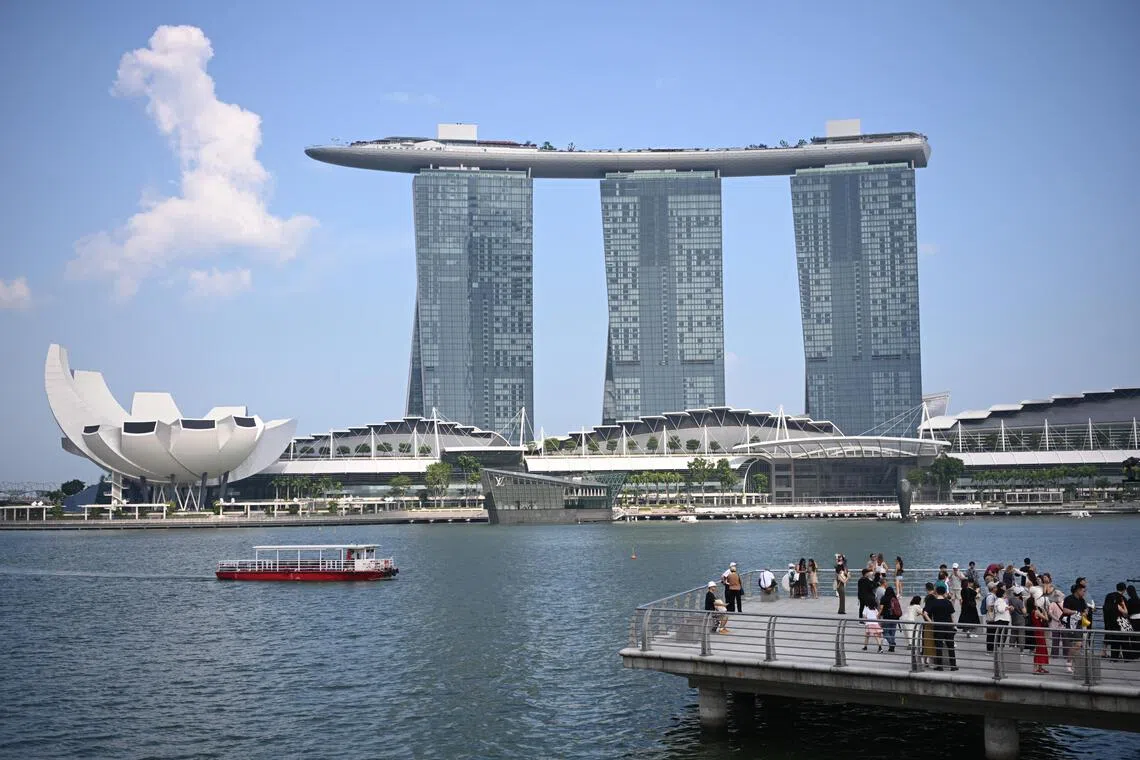
Singapore’s tourism performance for the first half of 2026 was largely stable.
ST PHOTO: AZMI ATHNI
Published Oct 15, 2026, 09:58 PM
Updated Oct 15, 2026, 09:58 PM
Singapore’s Q2 2026 tourism receipts fell 6.2% to $7.21 billion, with arrivals down 6.6% to 3.76 million, as STB cited global uncertainty and higher fuel costs.
Spending dropped across all major areas in Q2, led by sightseeing, entertainment and gaming, but H1 2026 was steadier, with receipts down only 0.3% to $15.71 billion.
China stayed the top source market for tourist spending, while shopping rose in H1, helped by new luxury openings and stronger retail experiences in Singapore.
SINGAPORE – The Republic collected $7.21 billion in tourism receipts in the second quarter of 2026, marking a 6.2% decline year-on-year, Singapore Tourism Board (STB) figures released on Oct 15 showed.
This mirrored a 6.6% slide in visitor arrivals to 3.76 million in Q2, and comes amid global turbulence. On a sequential basis, visitor spending dropped 15.4%, from $8.51 billion.
Still, taken together, the city-state’s performance for the first half of 2026 was largely stable.
The April-to-June data brings tourism receipts for H1 2026 to $15.71 billion, down by a marginal 0.3% from the year-ago period. This came alongside a 1.7% decrease in visitor arrivals to 8.19 million.
“The performance comes amid a challenging global environment,” said STB, citing the “escalation of the Middle East conflict in Q1 contributing to higher fuel costs , reduced air capacity and economic uncertainties that have affected international travel, particularly from European source markets”.
It added: “Despite these headwinds, tourism spending remained relatively resilient.”
Most components up year-on-year
Most components recorded decreases in tourist spending in Q2, but the H1 2026 performance was slightly more encouraging.
For Q2, the sightseeing, entertainment and gaming component (SEG) reported the largest decline, with tourism receipts sliding 15.4% to $1.58 billion.
Notably, the Fifa World Cup in June and July reportedly directed wagering budgets away from gaming and towards sports betting instead.
F&B (minus 9.8%) reflected the next-largest fall, followed by accommodation (minus 8.4%) and shopping (minus 1.5%).
On a quarterly basis, all components brought in less revenue in Q2 than the three months prior.
But for the six months from January to June, three of the five components published by STB had year-on-year increases: Shopping (2.9%), SEG (2.3%) and other components (1.6%).
STB pointed out that six of Singapore’s top 10 tourism receipt-generating markets recorded year-on-year increases in shopping spend.
The agency added that growth in shopping spend was supported by new luxury flagship openings since the end of 2025. These include Van Cleef & Arpels’ first duplex in South-east Asia at ION Orchard and brand activations such as the Loewe Foundation Craft Prize 2026 .
“Complementing this, Singapore’s local retail scene also offers differentiated shopping experiences, such as Dors at Design Orchard, featuring a wide range of home-grown brands, and lifestyle cluster New Bahru, which has expanded its retail mix within the Factory Block ,” STB added.
F&B tourist takings fell 6.2% year-on-year in H1 2026; accommodation takings were down 5.3%.
China drives receipts
On a yearly basis, China continued to be the top contributor for tourist spending in Q2. Tourists from China brought in $965.5 million, 1.9% lower than in Q2 2025.
Indonesia was the second-largest contributor, at $589.7 million, though takings fell 15.2% from a year earlier.
This was followed by Australia at $526.7 million (5.6%), India at $471.6 million (minus 5.6%) and the US at $427.2 million (16.1%).
By international visitor arrival volumes, the top countries of origin in Q2 were China (619,624), Indonesia (518,893), India (357,152), Malaysia (305,752) and Australia (294,086).
For H1 2026, the top three source countries by tourism receipts remained China, Indonesia and Australia, in that order. However, tourist spending by US tourists ($889.4 million) was higher than spending by Indian visitors ($839.6 million).
“The top three markets remained unchanged from H1 2025, with four of the top five markets recording year-on-year growth in tourism spending,” STB pointed out.
Geographically, tourists mostly came from China (1.5 million), Indonesia (1.1 million), Malaysia (644,661), Australia (605,972) and India (604,534). The US was the sixth-largest source of visitor arrivals in H1 2026. THE BUSINESS TIMES
Singapore Tourism Board
新加坡2026年上半年的旅游业表现总体稳定。
ST 摄影:AZMI ATHNI
发布于 2026 年 10 月 15 日晚上 9:58
更新于2026年10月15日晚上9:58
新加坡旅游局表示,受全球不确定性和燃油成本上涨的影响,新加坡2026年第二季度旅游收入下降6.2%至72.1亿美元,入境游客人数下降6.6%至376万人次。
第二季度所有主要领域的支出均有所下降,其中观光、娱乐和游戏领域的降幅最大;但 2026 年上半年情况较为稳定,收入仅下降 0.3% 至 157.1 亿美元。
中国仍然是游客消费的最大来源市场,而上半年购物消费有所增长,这得益于新加坡新开业的奢侈品店和更强大的零售体验。
新加坡——新加坡旅游局(STB)10月15日公布的数据显示,2026年第二季度新加坡旅游收入为72.1亿美元,同比下降6.2%。
这与第二季度游客到访量下滑6.6%至376万人次的情况相呼应,而此时全球经济形势动荡不安。环比来看,游客消费额下降了15.4%,从85.1亿美元降至376万人次。
不过,总体而言,该城邦在 2026 年上半年的经济表现基本保持稳定。
今年4月至6月的数据显示,2026年上半年旅游收入预计为157.1亿美元,较去年同期略微下降0.3%。与此同时,游客到访量下降1.7%,至819万人次。
“这一业绩是在全球环境充满挑战的情况下取得的,”STB表示,并指出“第一季度中东冲突升级导致燃油成本上升、航空运力下降以及经济不确定性,这些都影响了国际旅行,尤其是来自欧洲客源市场的旅行”。
报告还补充道:“尽管面临这些不利因素,旅游支出仍然保持相对韧性。”
大多数组成部分同比上涨
第二季度大多数组成部分的旅游支出均有所下降,但 2026 年上半年的表现略好一些。
第二季度,观光、娱乐和博彩业(SEG)降幅最大,旅游收入下滑 15.4% 至 15.8 亿美元。
值得注意的是,据报道,6 月和 7 月的 FIFA 世界杯将投注预算从游戏转向了体育博彩。
餐饮业(下降 9.8%)跌幅位居第二,其次是住宿业(下降 8.4%)和购物业(下降 1.5%)。
从季度来看,第二季度所有组成部分的收入均低于前三个月的收入。
但从 1 月到 6 月的六个月里,STB 公布的五个组成部分中有三个实现了同比增长:购物(2.9%)、SEG(2.3%)和其他组成部分(1.6%)。
新加坡旅游局指出,新加坡十大旅游收入来源市场中有六个市场的购物支出同比增长。
该机构补充说,自 2025 年底以来,新的奢侈品旗舰店开业支撑了购物支出的增长。其中包括 Van Cleef & Arpels 在 ION Orchard 开设的东南亚首家复式旗舰店,以及 Loewe 基金会 2026 年工艺奖等品牌推广活动。
新加坡旅游局补充道:“除此之外,新加坡本地零售业也提供差异化的购物体验,例如 Design Orchard 的 Dors,汇集了众多本土品牌;还有新峇鲁生活方式产业集群,其 Factory Block 内的零售业态也得到了扩展。”
2026 年上半年,餐饮旅游收入同比下降 6.2%;住宿收入下降 5.3%。
中国推动了经济增长。
从年度数据来看,中国仍然是第二季度旅游消费的最大贡献者。中国游客带来了9.655亿美元的旅游收入,比2025年第二季度下降了1.9%。
印度尼西亚是第二大贡献国,贡献额为 5.897 亿美元,但与上年相比下降了 15.2%。
其次是澳大利亚,为 5.267 亿美元(5.6%),印度为 4.716 亿美元(-5.6%),美国为 4.272 亿美元(16.1%)。
按国际游客到访量计算,第二季度游客来源国排名前列的国家是中国(619,624)、印度尼西亚(518,893)、印度(357,152)、马来西亚(305,752)和澳大利亚(294,086)。
2026年上半年,旅游收入排名前三的客源国依然是中国、印度尼西亚和澳大利亚。然而,美国游客的旅游消费(8.894亿美元)高于印度游客的消费(8.396亿美元)。
新加坡旅游局指出:“到 2025 年上半年,前三大市场保持不变,前五大市场中有四个市场的旅游支出实现了同比增长。”
从地域上看,游客主要来自中国(150万人)、印度尼西亚(110万人)、马来西亚(644,661人)、澳大利亚(605,972人)和印度(604,534人)。美国是2026年上半年游客到访量的第六大来源国。《商业时报》
新加坡旅游局