Public cleanliness satisfaction falls to 91%; toilets and neighbourhood spaces see biggest declines: SMU survey新加坡管理大学调查显示,公众对公共卫生满意度降至91%;厕所和社区空间的满意度下降幅度最大。
More residents say they feel personally responsible for keeping shared spaces clean, even as satisfaction with public cleanliness fell across the areas surveyed.
More residents say they feel personally responsible for keeping shared spaces clean, even as satisfaction with public cleanliness fell across the areas surveyed.
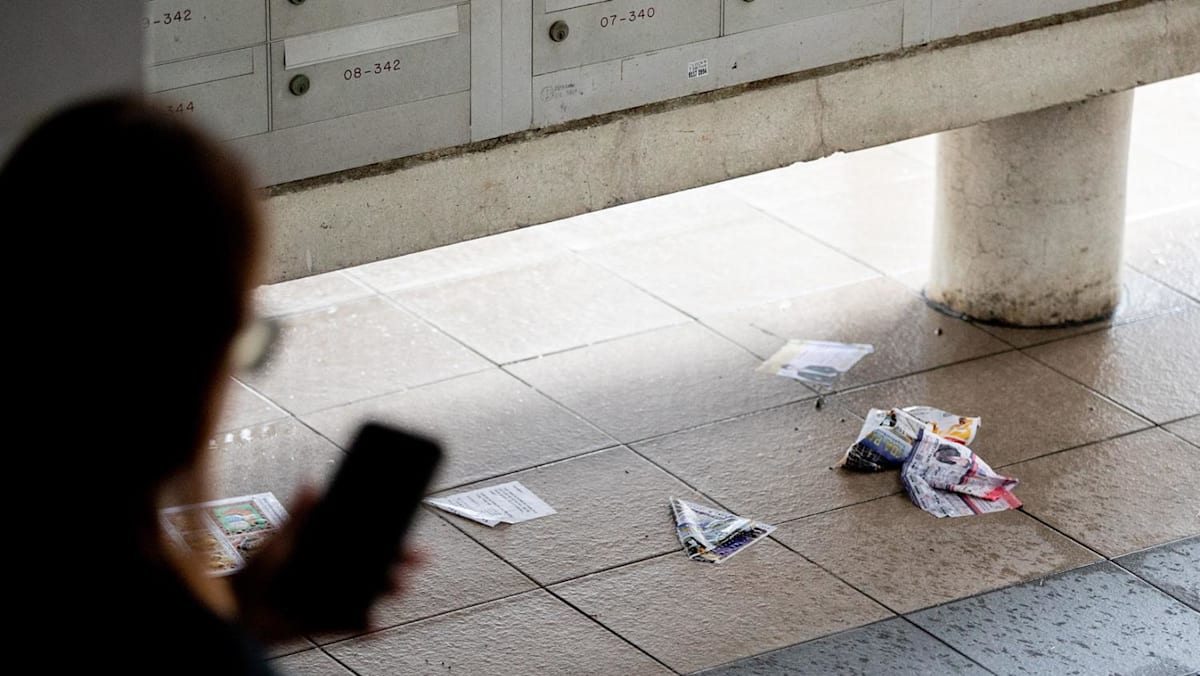
Litter seen on the floor of a housing block's void deck in Toa Payoh, on Mar 5, 2024.
This audio is generated by an AI tool.
SINGAPORE: Satisfaction with public cleanliness fell to 91 per cent in 2025 from 94 per cent in 2023, with neighbourhood spaces recording the biggest decline among six domains surveyed, a study released on Friday (Sep 4) found.
Satisfaction with public toilets also fell sharply.
The study's researchers said the decline could partly reflect rising expectations, as Singaporeans have become accustomed to higher standards of cleanliness over the years.
The latest figure still marks a significant rise from 2017, when overall satisfaction stood at 82 per cent in the survey's first edition.
CNA Games Guess Word Crack the word, one row at a time Buzzword Create words using the given letters Mini Sudoku Tiny puzzle, mighty brain teaser Mini Crossword Small grid, big challenge Word Search Spot as many words as you can Show More Show Less The 2025 Public Cleanliness Satisfaction Survey, conducted by the Singapore Management University (SMU), is the seventh edition of the study, led by Professor of Sociology (Practice) Paulin Tay Straughan and Dr Mathew Mathews, principal research fellow at the Institute of Policy Studies. It surveyed 2,007 Singapore citizens and permanent residents aged 21 and above between December 2025 and April 2026. The findings come as the National Environment Agency (NEA) reported fewer fines and corrective work orders in the first half of this year compared with the same period last year, a decline it attributed to continued efforts to clean up targeted littering hotspots. NEIGHBOURHOOD SPACES SEE SHARPEST FALL All six domains measured – transportation nodes, leisure venues, commuter paths, spaces after public events, neighbourhood spaces and food outlets – recorded lower satisfaction than in 2023. Transportation nodes and leisure venues remained the highest-rated, though satisfaction slipped in both: from 98.3 per cent to 97.2 per cent for transportation spaces such as roads, bus stops and MRT and LRT stations, and from 96.8 per cent to 95.1 per cent for leisure spaces such as parks, malls and playgrounds. Neighbourhood spaces recorded the steepest dip of the six, falling from 93.3 per cent to 87.4 per cent, their lowest level since 2018. The decline was sharpest at void decks, corridors and lift lobbies, where satisfaction fell 8.8 percentage points to 80.9 per cent, the largest drop among all 20 public spaces surveyed. Asked about the decline in neighbourhood satisfaction, the researchers said several factors could be at play, including higher expectations, more waste from increased deliveries and whether cleaning services have kept pace amid higher manpower costs. Food outlets remained the lowest-rated of the six domains, as they have been since 2021, with satisfaction falling 2.8 percentage points to 82.4 per cent. Hawker centres and coffee shops continued to be among the weakest performers, falling 5.5 percentage points to 76.4 per cent and 3.6 points to 76.8 per cent respectively. Prof Straughan suggested that temperature could also shape perceptions of cleanliness, with patrons potentially less tolerant of non-air-conditioned hawker centres and coffee shops than of air-conditioned food courts. "When it's hot, there's this perception that there's this level of grime ... everybody is so grumpy, so that also affects how we perceive cleanliness of the spaces shared," she said.
The 2025 Public Cleanliness Satisfaction Survey, conducted by the Singapore Management University (SMU), is the seventh edition of the study, led by Professor of Sociology (Practice) Paulin Tay Straughan and Dr Mathew Mathews, principal research fellow at the Institute of Policy Studies.
It surveyed 2,007 Singapore citizens and permanent residents aged 21 and above between December 2025 and April 2026.
The findings come as the National Environment Agency (NEA) reported fewer fines and corrective work orders in the first half of this year compared with the same period last year, a decline it attributed to continued efforts to clean up targeted littering hotspots.
NEIGHBOURHOOD SPACES SEE SHARPEST FALL
All six domains measured – transportation nodes, leisure venues, commuter paths, spaces after public events, neighbourhood spaces and food outlets – recorded lower satisfaction than in 2023.
Transportation nodes and leisure venues remained the highest-rated, though satisfaction slipped in both: from 98.3 per cent to 97.2 per cent for transportation spaces such as roads, bus stops and MRT and LRT stations, and from 96.8 per cent to 95.1 per cent for leisure spaces such as parks, malls and playgrounds.
Neighbourhood spaces recorded the steepest dip of the six, falling from 93.3 per cent to 87.4 per cent, their lowest level since 2018.
The decline was sharpest at void decks, corridors and lift lobbies, where satisfaction fell 8.8 percentage points to 80.9 per cent, the largest drop among all 20 public spaces surveyed.
Asked about the decline in neighbourhood satisfaction, the researchers said several factors could be at play, including higher expectations, more waste from increased deliveries and whether cleaning services have kept pace amid higher manpower costs.
Food outlets remained the lowest-rated of the six domains, as they have been since 2021, with satisfaction falling 2.8 percentage points to 82.4 per cent. Hawker centres and coffee shops continued to be among the weakest performers, falling 5.5 percentage points to 76.4 per cent and 3.6 points to 76.8 per cent respectively.
Prof Straughan suggested that temperature could also shape perceptions of cleanliness, with patrons potentially less tolerant of non-air-conditioned hawker centres and coffee shops than of air-conditioned food courts.
"When it's hot, there's this perception that there's this level of grime ... everybody is so grumpy, so that also affects how we perceive cleanliness of the spaces shared," she said.
PUBLIC TOILET SATISFACTION DECLINES
Separately from the six domains, the survey also tracked public toilets, where satisfaction fell 8.2 percentage points, from 83.7 per cent to 75.5 per cent.
Coffee shop toilets fared worst, dropping 12 points to 48.3 per cent, while hawker centre toilets fell 10 points to 60 per cent. Toilets in downtown and central business district malls remained the best-rated, at 93.6 per cent.
The fall in toilet satisfaction comes even as the Public Toilets Taskforce, set up in 2024, has recommended measures including grants for coffee shop operators to renovate and deep-clean their toilets.
The study suggested these efforts may have raised public expectations, adding: "The full benefits of these efforts may take time to be felt, particularly in high-footfall dining environments where maintaining cleanliness presents greater operational challenges, and where continued focus is expected to yield meaningful improvements over time."
Respondents were also less likely than before to see individual users as primarily responsible for toilet cleanliness, with more attributing responsibility to operators and premises owners instead.
"This may suggest that public toilet cleanliness is perceived differently from other public cleanliness issues and highlights the continued need to reinforce individual responsibility for maintaining clean public toilets," the study said.
Dr Mathews said people may expect more of themselves in places where they feel they have greater power and agency.
" But in areas like the toilet, for instance, people may not feel that they have the same level of ability to do something. But nonetheless, it's something that needs to continue to be highlighted - that everybody can play a part in (making) things better, even in bathrooms."
PERSONAL RESPONSIBILITY ON THE RISE
Despite the overall decline, 98.6 per cent of respondents agreed that keeping Singapore clean is the responsibility of every individual.
Among those who disposed of rubbish properly, 71.3 per cent cited a sense of personal responsibility, up from 65.2 per cent in 2023, while 53.6 per cent cited caring for the environment, up from 48.1 per cent. Fewer respondents cited external motivations such as the risk of fines or embarrassment.
A similar pattern held for tray return: 95.5 per cent said they always returned their trays and crockery, edging up from 95 per cent in 2023, while the proportion who viewed individual patrons as primarily responsible for the practice rose from 79.9 per cent to 83.3 per cent. Social responsibility remained the most common reason cited, at 77.7 per cent.
The study said the findings were observed despite slight declines in awareness, support and perceived effectiveness of anti-littering enforcement measures.
"This may suggest that behaviours such as tray return and proper disposal of litter are increasingly becoming socially expected behaviours rather than actions motivated primarily by fear of enforcement," the study said, adding that campaigns and enforcement over the years may have helped such norms take hold.
Enforcement of tray and crockery return began in phases from September 2021 and was stepped up in June 2023, when first-time offenders were issued written warnings while repeat offenders could be fined or charged in court.
Prof Straughan said the results suggested that the messaging around the tray-return law had worked.
"Rather than a punitive measure, the rationale for the law was articulated well. So I think many social agencies helped to make sure that the narrative was directed at the right centre, so we're seeing the fruits of that labour now."
The proportion who said they would look for another rubbish bin when faced with an overflowing one fell from 80.8 per cent to 76.9 per cent.
About 19 per cent of respondents felt there were not enough bins, nearly double the 10.4 per cent in 2023. Wet markets, hawker centres and coffee shops were most often flagged as short on bins.
Prof Straughan said one thing that stood out clearly in the survey results was a shift towards people taking greater ownership of the cleanliness of shared spaces.
"Taking ownership can mean many things. You know, you don't blame others. That's one, right? So we are blaming, you know, cleaners less. We try not to dirty it ourselves, and clearly that is reflected in you know some of the things that we try to do: Not litter, clean up after ourselves in hawker centres".
However, she said more people could be encouraged to give feedback. describing this as one area where a sense of disempowerment was reflected in the survey results.
Only 71.8 per cent of respondents said they knew how to provide feedback on the quality of cleaning services in 2025, down from 81.5 per cent in 2023.
"The mechanism for receiving feedback must be perceived of as being effective. Otherwise, why waste time, right? So that's one area perhaps we could work on."
Prof Straughan said the next step – and one that people may still be some way from – is taking proactive action beyond their own behaviour, such as picking up other people's litter.
"This is one step that I think we have not been able to cross over. So how do we encourage that? There has to be a way. So this is an area that I think we need to work on."
An overflowing recycling bin at a housing block in Punggol. (File photo: Veron Wong)
FEWER WILLING TO PAY MORE OR VOLUNTEER
While most respondents felt residents should be encouraged to help maintain the cleanliness of the neighbourhood, this did not necessarily translate into a willingness to take part in broader community efforts.
Support for residents helping maintain neighbourhood cleanliness remained high, at 96.7 per cent, and 96.5 per cent agreed residents and cleaners should work together. But less than half, 49.6 per cent, said they would volunteer with a neighbourhood cleanliness group, down from 63.5 per cent.
Support for organised initiatives also weakened – backing for pausing public cleaning once every three months fell from 80.9 per cent to 75.4 per cent, while support for quarterly mass litter-picking exercises fell from 83.7 per cent to 76 per cent.
Willingness to personally join such exercises nonetheless rose slightly, from 56 per cent to 57.8 per cent.
Prof Straughan suggested that people do not necessarily know how to participate, adding that community involvement would need to become a regular, normalised activity rather than an occasional campaign.
Appetite to pay for more cleaning also fell. The proportion who felt more should be spent on cleaning services dropped from 74.8 per cent to 58.1 per cent, while the proportion willing to pay more through higher service and conservancy charges fell from 45.5 per cent to 32 per cent.
The study concluded that the norms and behaviours promoted through public cleanliness campaigns and enforcement measures in recent years "have become increasingly embedded in everyday life".
"Nevertheless, with such increasingly embedded norms, expectations of cleanliness standards among the population may have increased, which inevitably decreases satisfaction levels at least slightly."
Prof Straughan said it was important to empower communities to take greater ownership of shared spaces, suggesting that neighbourhood hawker centres and coffee shops could be seen as "community kitchens" that residents have a role in looking after.
"Community spaces are very, very important. So that's where we hope, we can agitate some social activism in communities for them to just take ownership. So stop complaining about the hawker centres and coffee shops, but take action.
"Because we also don't want to pay more. That's very clear. So if you don't want to pay more, then you have to take action. You have to demonstrate agency and collectively in a nice way, in a positive way."
Get our pick of top stories and thought-provoking articles in your inbox
Stay updated with notifications for breaking news and our best stories
Join our channel for the top reads for the day on your preferred chat app
更多居民表示他们有义务保持公共空间的清洁,尽管在调查区域内,公众对公共清洁的满意度有所下降。
2024年3月5日,在大巴窑一栋组屋楼下的空地上发现垃圾。
这段音频由人工智能工具生成。
新加坡:周五(9月4日)发布的一项研究发现,公众对公共清洁的满意度将从2023年的94%下降到2025年的91%,在调查的六个领域中,社区空间的满意度下降幅度最大。
公众对公共厕所的满意度也大幅下降。
该研究的研究人员表示,这种下降可能部分反映了人们期望的提高,因为多年来新加坡人已经习惯了更高的清洁标准。
最新数据显示,与 2017 年的调查结果相比,总体满意度仍然显著上升,当时该调查第一版的总体满意度为 82%。
CNA游戏 猜词游戏 逐行破解单词 流行词游戏 用给定的字母组成单词 迷你数独 小谜题,脑力挑战 迷你填字游戏 小方格,大挑战 单词搜索 尽可能多地找出单词 显示更多 显示更少 新加坡管理大学 (SMU) 开展的《2025年公共清洁满意度调查》是该研究的第七版,由社会学(实践)教授保琳·泰·斯特劳恩 (Paulin Tay Straughan) 和政策研究所首席研究员马修·马修斯 (Mathew Mathews) 博士领导。该调查于2025年12月至2026年4月期间进行,共调查了2007名21岁及以上的新加坡公民和永久居民。与此同时,国家环境局 (NEA) 报告称,今年上半年罚款和整改令的数量较去年同期有所下降,NEA将此归因于持续清理特定垃圾热点地区的努力。社区空间满意度降幅最大。所有六个评估领域——交通枢纽、休闲场所、通勤路径、公共活动后空间、社区空间和餐饮场所——的满意度均低于2023年的预期。交通枢纽和休闲场所的满意度仍然最高,但两者均有所下滑:交通枢纽(如道路、公交车站、地铁和轻轨站)的满意度从98.3%降至97.2%,休闲场所(如公园、商场和游乐场)的满意度从96.8%降至95.1%。社区空间的满意度降幅最大,从93.3%降至87.4%,为2018年以来的最低水平。其中,组屋底层、走廊和电梯大堂的满意度降幅最为显著,下降了8.8个百分点至80.9%,在所有20个受调查的公共空间中降幅最大。当被问及社区满意度下降的原因时,研究人员表示,可能有多种因素在起作用,包括更高的期望值、外卖增加导致的垃圾增多,以及在人力成本上涨的情况下,清洁服务是否跟上了步伐。食品店的满意度仍然是六个领域中最低的,与2021年以来的情况相同,满意度下降了2.8个百分点,至82.4%。小贩中心和咖啡店的表现依然最差,满意度分别下降了5.5个百分点,至76.4%和3.6个百分点,至76.8%。斯特劳恩教授认为,温度也会影响人们对清洁度的感知,顾客可能对没有空调的小贩中心和咖啡店的容忍度低于有空调的美食广场。“天气热的时候,人们会觉得周围很脏……每个人都很烦躁,这也会影响我们对公共空间清洁度的感知,”她说道。
由新加坡管理大学 (SMU) 进行的 2025 年公共清洁满意度调查是该研究的第七版,由社会学(实践)教授 Paulin Tay Straughan 和政策研究所首席研究员 Mathew Mathews 博士领导。
该调查于 2025 年 12 月至 2026 年 4 月期间进行,调查对象为 2007 名 21 岁及以上的新加坡公民和永久居民。
调查结果出炉之际,国家环境局 (NEA) 报告称,今年上半年罚款和整改令的数量比去年同期有所减少,该机构将这一下降归因于持续努力清理有针对性的乱扔垃圾热点地区。
社区空间降幅最大
所有六个测量领域——交通枢纽、休闲场所、通勤路线、公共活动后的空间、社区空间和食品店——的满意度均低于 2023 年的水平。
交通枢纽和休闲场所的评分仍然最高,但两者的满意度均有所下降:道路、公交车站、地铁和轻轨站等交通场所的满意度从 98.3% 下降到 97.2%,公园、商场和游乐场等休闲场所的满意度从 96.8% 下降到 95.1%。
邻里空间的使用率在六个类别中降幅最大,从 93.3% 降至 87.4%,为 2018 年以来的最低水平。
下降幅度最大的是组屋底层、走廊和电梯大堂,满意度下降了 8.8 个百分点,至 80.9%,是调查的 20 个公共空间中降幅最大的。
当被问及社区满意度下降的原因时,研究人员表示,可能有多种因素在起作用,包括更高的期望、送货量增加导致的更多浪费,以及在人力成本上升的情况下,清洁服务是否跟上了步伐。
餐饮场所仍然是六个领域中评分最低的,与2021年以来的情况相同,满意度下降了2.8个百分点至82.4%。小贩中心和咖啡店的表现仍然最差,满意度分别下降了5.5个百分点至76.4%和3.6个百分点至76.8%。
斯特劳恩教授认为,温度也会影响人们对清洁度的感知,顾客对没有空调的小贩中心和咖啡店的容忍度可能低于对有空调的美食广场的容忍度。
“天气热的时候,人们会觉得周围很脏……每个人都很暴躁,这也会影响我们对公共空间清洁度的看法,”她说。
公共厕所满意度下降
除了上述六个领域之外,该调查还追踪了公共厕所的情况,满意度下降了 8.2 个百分点,从 83.7% 降至 75.5%。
咖啡店厕所的满意度最低,下降了12个百分点,至48.3%;小贩中心厕所的满意度下降了10个百分点,至60%。市中心和中央商务区商场的厕所满意度最高,达到93.6%。
尽管成立于 2024 年的公共厕所工作组建议采取措施,包括向咖啡店经营者提供补助金以翻新和深度清洁其厕所,但厕所满意度仍然下降。
该研究表明,这些努力可能提高了公众的期望,并补充道:“这些努力的全部益处可能需要一段时间才能显现,尤其是在人流量大的餐饮环境中,保持清洁会带来更大的运营挑战,而持续的关注有望随着时间的推移带来有意义的改进。”
受访者也比以前更不倾向于认为个人用户是厕所清洁的主要责任人,更多的人则将责任归咎于经营者和场所所有者。
该研究称:“这可能表明,人们对公共厕所清洁的看法与其他公共清洁问题不同,并凸显了继续加强个人对保持公共厕所清洁的责任的必要性。”
马修斯博士表示,在人们感到自己拥有更大权力和自主权的地方,人们可能会对自己有更高的期望。
“但例如在厕所这类地方,人们可能觉得自己没有同样的能力去做事。尽管如此,这一点仍需不断强调——每个人都可以为改善现状贡献一份力量,即使是在卫生间这种地方。”
个人责任感日益增强
尽管整体呈下降趋势,但 98.6% 的受访者认为保持新加坡清洁是每个人的责任。
在那些正确处理垃圾的人中,71.3%的人表示是出于个人责任感,高于2023年的65.2%;53.6%的人表示是出于保护环境的考虑,高于2023年的48.1%。较少受访者提到诸如罚款风险或尴尬等外部动机。
餐盘归还情况也呈现类似趋势:95.5%的受访者表示他们总是归还餐盘和餐具,略高于2023年的95%;同时,认为顾客个人应承担主要责任的受访者比例从79.9%上升至83.3%。社会责任仍然是最常见的理由,占比77.7%。
该研究指出,尽管人们对乱扔垃圾执法措施的认识、支持和感知有效性略有下降,但仍然观察到了上述结果。
该研究称:“这可能表明,诸如归还餐盘和妥善处理垃圾等行为正日益成为社会期望的行为,而不是主要出于害怕执法而采取的行动。”研究还补充说,多年来的宣传活动和执法可能有助于此类规范的形成。
从 2021 年 9 月起,餐盘和餐具归还的执法工作分阶段开始,并在 2023 年 6 月加大了力度,初犯者将收到书面警告,而屡犯者可能会被罚款或被起诉。
斯特劳恩教授表示,结果表明,围绕餐盘归还法的宣传工作已经奏效。
“这项法律并非惩罚性措施,其理由阐述得非常清楚。所以我认为,许多社会机构都帮助确保了舆论导向正确,因此我们现在看到了这些努力的成果。”
表示在垃圾桶溢出时会寻找另一个垃圾桶的比例从 80.8% 下降到 76.9%。
约 19% 的受访者认为垃圾桶数量不足,几乎是 2023 年 10.4% 的两倍。湿巴刹、小贩中心和咖啡店最常被认为垃圾桶短缺。
斯特劳恩教授表示,调查结果中一个非常突出的现象是,人们越来越重视公共空间的清洁卫生。
“承担责任可以有很多种含义。你知道,就是不责怪别人。这是其中之一,对吧?所以我们现在很少责怪清洁工。我们自己也尽量不弄脏环境,这一点显然体现在我们努力做的一些事情上:不乱扔垃圾,在小贩中心吃完东西后自己清理干净。”
然而,她表示可以鼓励更多人提供反馈意见,并指出这是调查结果中反映出的一种无力感的领域。
2025 年,只有 71.8% 的受访者表示他们知道如何就清洁服务的质量提供反馈,低于 2023 年的 81.5%。
“必须让用户觉得反馈机制有效。否则,何必浪费时间呢?所以,这或许是我们能够着手改进的一个方面。”
斯特劳恩教授表示,下一步——也是人们可能还有一段路要走的——是采取超越自身行为的积极行动,例如捡起别人丢弃的垃圾。
“我认为这是我们尚未跨越的一步。那么我们该如何鼓励这种转变呢?肯定有办法的。所以,我认为这是我们需要努力的方向。”
榜鹅一栋组屋的回收箱已满。(资料照片:Veron Wong)
愿意支付更多费用或做志愿者的人越来越少
虽然大多数受访者认为应该鼓励居民帮助保持社区的清洁,但这并不一定意味着他们愿意参与更广泛的社区活动。
居民对维护社区清洁的支持率仍然很高,达到96.7%,96.5%的居民同意居民和清洁人员应该共同合作。但只有不到一半(49.6%)的居民表示愿意加入社区清洁小组做志愿者,低于之前的63.5%。
对有组织的倡议的支持也有所减弱——支持每三个月暂停一次公共清洁的比例从 80.9% 下降到 75.4%,而支持每季度进行一次大规模垃圾清理活动的比例从 83.7% 下降到 76%。
尽管如此,亲自参加此类活动的意愿略有上升,从 56% 上升到 57.8%。
斯特劳恩教授认为,人们未必知道如何参与,并补充说,社区参与需要成为一种常规的、常态化的活动,而不是偶尔的活动。
人们为清洁服务付费的意愿也有所下降。认为应该在清洁服务上投入更多资金的比例从74.8%下降到58.1%,而愿意通过提高服务费和维护费来支付更多费用的比例则从45.5%下降到32%。
该研究得出结论,近年来通过公共卫生运动和执法措施所倡导的规范和行为“已日益融入日常生活”。
“然而,随着这些规范日益根深蒂固,民众对清洁标准的期望可能会提高,这必然会导致满意度至少略有下降。”
斯特劳恩教授表示,赋予社区更大的权力来拥有共享空间非常重要,他建议可以将邻里小贩中心和咖啡店视为“社区厨房”,居民可以参与照管这些场所。
“社区空间非常非常重要。所以我们希望能够激发社区的社会行动主义,让社区居民真正拥有并利用这些空间。不要再抱怨小贩中心和咖啡店了,而是要采取行动。”
“因为我们也不想多花钱。这一点很明确。所以,如果你不想多花钱,那就必须采取行动。你必须展现出自主性,并且以一种友好、积极的方式集体行动起来。”
订阅我们的邮件,即可获取精选热点新闻和引人深思的文章。
订阅通知,第一时间获取突发新闻和精彩报道。
加入我们的频道,即可在您常用的聊天应用上获取当日热门文章。