Explore Thousands Of FAA Drone And Unidentified Aircraft Incident Reports With Our Interactive Tool使用我们的交互式工具,探索数千份美国联邦航空管理局 (FAA) 无人机和不明飞行物事件报告。
The FAA has a little-known database with over 10,000 incident reports. Our new application intends to crowdsource the investigation into them.
新闻视频
Updated Jul 14, 2021 5:58 PM EDT
We are excited to announce the launch of our new interactive tool that maps and makes searchable thousands of unmanned aircraft system (UAS) and unidentified aircraft incident reports. The vast dataset is drawn from information compiled by the Federal Aviation Administration . Some of the reports are highly unusual, going far beyond typical low-altitude drone mishaps.
To our knowledge, this is the first attempt to make a publicly available system that can both seamlessly search and map these incidents. Though the data in the reports is often cursory, it provides a mechanism to identify and further investigate significant incidents and to interpret broader trends.
UAS incidents with manned aircraft have become increasingly commonplace in recent years, with some posing significant aviation safety and national security concerns. The term UAS is used to convey a wide variety of aircraft, including rotary and fixed-wing drones as well as balloons and less clearly identified types.
The War Zone has covered a number of high-profile UAS incidents. For example, earlier this year a “highly modified” drone in Tucson penetrated controlled airspace, leading to a prolonged helicopter chase and no success in identifying the operator or the high-performance drone type. Drones have also become a significant issue for nuclear reactor safety, including a still unresolved incident involving multiple drones descending on the nation’s most powerful nuclear reactor in Palo Verde , Arizona.
The issue has also significantly impacted the military. The War Zone covered an incident that involved a large number of drones apparently harassing Navy vessels near Southern California. Our subsequent investigation of FAA records surfaced nearly two dozen other reports of unusual UAS activity near military facilities or aircraft. These new records come in addition to exclusive past reporting on aviation safety hazards off the East Coast and similar records released by the Air Force .
The UAS issue has in many ways converged with an ongoing national discussion on “unidentified aerial phenomena” or UAP. The Office of Director of National Intelligence recently released a long awaited report on UAP that prominently cited the importance of FAA data in resolving unidentified aircraft sightings. The UAPTF report acknowledged that some reports may be attributable to foreign adversaries, though there is no direct evidence of such at this time. The War Zone has explored the potential connection between UAP sightings and UAS at length.
The original FAA data consists of approximately 10,400 incident reports published online via a number of Excel spreadsheets. The FAA offers few details about how the reports are collected, or how they are ultimately selected for this public dataset. A significant number of the summaries involve references to Mandatory Occurrence Reports (MOR), an FAA process designed to capture a wide array of information about aviation safety incidents. According to FAA regulations , a MOR must be generated whenever a pilot reports “unauthorized UAS activity or authorized UAS activity that is conducted in an unsafe or hazardous manner.”
Example FAA Mandatory Occurrence Report , Federal Aviation Administration
Example FAA Mandatory Occurrence Report
The UAS Sightings Report data span from November of 2014 until December 2020. We have standardized and joined these spreadsheets together into one consolidated resource. Although the reports do not include precise location information, we have been able to assign approximate locations using the city and state information provided. Importantly, we have introduced a small amount of randomness to the locations in order to prevent the incidents in the same city from overlapping each other on the map. Please note that the location on the map does not correspond precisely to the location of the incident. In fact, based on our previous reporting , we have found that the actual location of the incident can be many miles from the city cited in the report.
Further, there are a large number of spelling errors and other issues in the original data, so not all locations have been matched to date. Currently, our mapping system has geocoded 9566 reports. We are working to resolve the location information on the remaining reports.
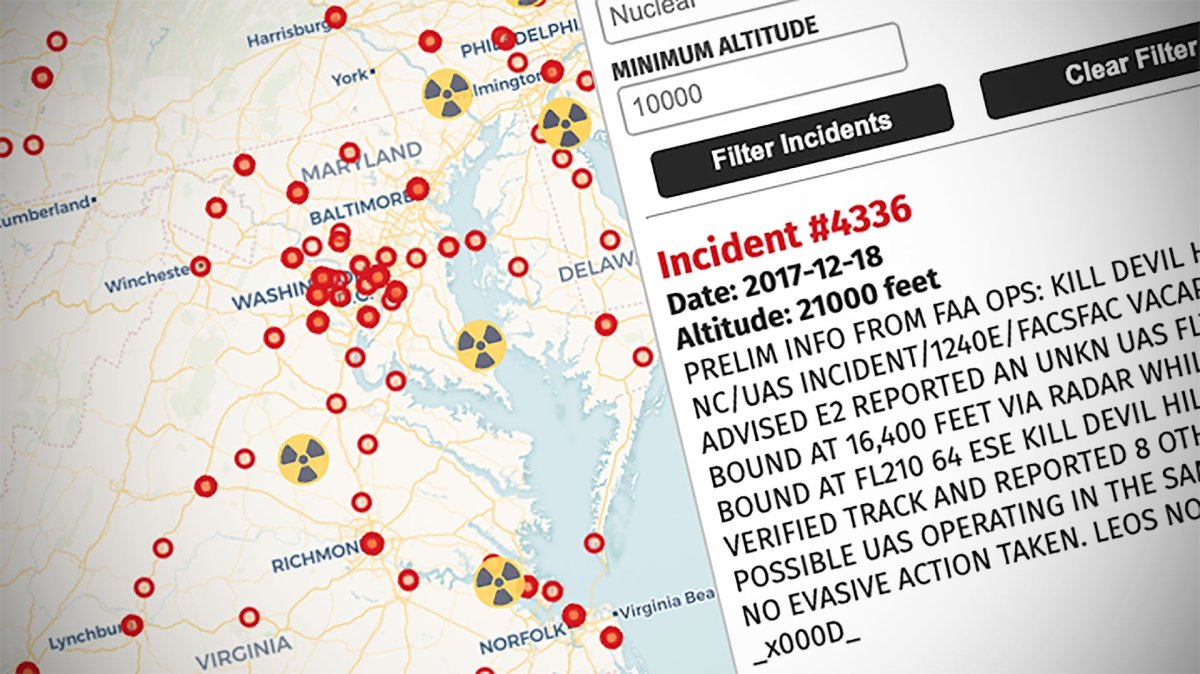
We have also implemented a tool to extract the approximate altitude of the incident based on the summary text. Due to variations in the underlying reports, the tool is not able to capture altitudes for all incidents.
Our system currently allows users to search either by keywords in the incident summary, or by filtering a minimum altitude. With the caveat that altitude information is imputed and not included in the original data, we found that the maximum reported altitude was 39,000 feet, with a median altitude of 1,500 feet.
You can also browse the cases in the embedded map below. Due to the prevalence of UAS incidents around strategic infrastructure, we have included the ability to mark key locations on the map to better find incidents. In this initial release, we have incorporated the location of active nuclear reactors in the United States. Those locations are marked with an icon displaying the ionizing radiation hazard symbol.
Please note that due to the number of incidents that the map may take a few moments to load depending on your connection due to the large amount of data:
UAVGeography.com , Screenshot of UAVGeography.com, Adam Kehoe
This tool also permits searching the incident reports by keyword. Many of the stories involving UAS described above can be found in the case summaries in this data. In fact, the tool has allowed us to revisit some cases and locations to develop new leads. We invite readers to search and share their own findings with us so we can further investigate ‘unique’ cases. We will be publishing a separate piece shortly detailing a number of new cases that we are investigating and will continue to pursue additional leads.
You can access the tool with its full feature set via this link , as well.
We plan to make updates and improvements to the system over time. This initial release of the tool is designed to quickly give the public access to this data, particularly given the growing concern regarding UAS. As the system grows, we plan to incorporate more search and filtering functionality. We also plan to make further improvements to the location matching system and our ability to extract altitude information. The summary reports also contain a wealth of unstructured information that can be leveraged in the coming weeks, such as references to the color, size and behavior of the UAS.
Our experience navigating and searching the system suggests some possible future directions. For example, we created a separate tool that allows users to visualize incident reports in three dimensions. This capability is particularly useful when viewing urban areas that have a large number of “nuisance” type incidents at lower altitudes. You can see a brief video of the 3d capability below:
We are unable to distribute the 3d version of the application widely without significant costs, but we are offering limited access to analysts interested in trying the tool. Note that this version only includes a different mode of visualizing cases, and otherwise has identical data as the open version.
On the whole, we hope this tool will allow the public to develop a greater appreciation of the scale and seriousness of UAS incidents. The tool may also help provide context for the difficult job of air traffic controllers and pilots to manage an increasingly complex sky. The number and variety of UAS and other craft, like balloons, pose clear challenges for pilots and aircrew to clearly identify what they are seeing, especially given the relatively small size of many of the reported objects. The large community of open-source intelligence professionals and enthusiasts may also play a helpful role in identifying and analyzing significant events. There are some that are very peculiar, involving remarkably high altitudes and multiple craft, among other bizarre factors. As always, The War Zone will continue to update and develop this story as new information and data becomes available.
We will publish an initial analysis of unique cases we have identified using this new tool shortly. We again ask that readers share their tips with us so we can look into other strange incidents that may be buried in the data set.
Contact the author: Adam@thewarzone.com
Comments couldn’t be loaded. Please refresh the page.
更新于美国东部时间2021年7月14日下午5:58
我们很高兴地宣布推出全新的交互式工具,该工具可对数千份无人机系统 (UAS) 和不明飞行物事故报告进行地图标注和搜索。庞大的数据集来源于美国联邦航空管理局 (FAA) 收集的信息。其中一些报告非常特殊,远远超出了典型的低空无人机事故范畴。
据我们所知,这是首次尝试建立一个可公开访问的系统,该系统能够无缝地搜索和绘制这些事件的分布图。尽管报告中的数据通常较为粗略,但它提供了一种机制,用于识别和深入调查重大事件,并解读更广泛的趋势。
近年来,无人机系统(UAS)与载人飞机相撞的事件日益增多,其中一些事件引发了严重的航空安全和国家安全问题。无人机系统(UAS)一词涵盖了多种类型的飞行器,包括旋翼无人机、固定翼无人机、气球以及其他一些难以明确识别的类型。
《战区》栏目报道了多起备受瞩目的无人机事件。例如,今年早些时候,一架经过“高度改装”的无人机在图森市闯入管制空域,引发了长时间的直升机追逐,但最终未能确定操作员身份或无人机的具体型号。无人机也已成为核反应堆安全方面的一个重大问题,其中包括多架无人机降落在亚利桑那州帕洛维德核电站(美国最强大的核反应堆)附近,该事件至今仍未得到解决。
这个问题也对军方产生了重大影响。《战区》栏目曾报道过一起事件,大量无人机疑似在南加州附近骚扰海军舰艇。我们随后对美国联邦航空管理局(FAA)记录的调查发现了近二十起其他关于军事设施或飞机附近出现异常无人机活动的报告。这些新记录是对此前独家报道的东海岸航空安全隐患以及空军公布的类似记录的补充。
无人机系统(UAS)问题在许多方面都与当前美国国内关于“不明空中现象”(UAP)的讨论不谋而合。美国国家情报总监办公室近期发布了一份期待已久的关于UAP的报告,该报告重点强调了美国联邦航空管理局(FAA)数据在解决不明飞行物目击事件中的重要性。UAP工作组的报告承认,部分报告可能与外国敌对势力有关,但目前尚无直接证据。“战区”(The War Zone)网站已对UAP目击事件与无人机系统之间的潜在联系进行了深入探讨。
美国联邦航空管理局(FAA)的原始数据包含约10,400份事故报告,这些报告以Excel表格的形式在线发布。FAA并未详细说明这些报告是如何收集的,或者最终是如何从众多报告中筛选出纳入此公共数据集的。大量摘要都提到了强制性事故报告(MOR),这是FAA为收集航空安全事故相关信息而制定的流程。根据FAA的规定,每当飞行员报告“未经授权的无人机系统活动或以不安全或危险方式进行的授权无人机系统活动”时,都必须生成一份MOR。
美国联邦航空管理局强制性事故报告示例
美国联邦航空管理局强制性事故报告示例
无人机目击报告的数据涵盖2014年11月至2020年12月。我们已将这些电子表格标准化并整合为一个统一的资源。虽然报告中未包含精确的位置信息,但我们已能够根据所提供的城市和州信息推断出大致位置。重要的是,我们对位置信息进行了少量随机化处理,以防止同一城市发生的事件在地图上重叠。请注意,地图上的位置并不完全对应事件发生的实际位置。事实上,根据我们之前的报告,我们发现事件的实际发生地点可能与报告中提及的城市相距甚远。
此外,原始数据中存在大量拼写错误和其他问题,因此目前并非所有地点都已匹配。目前,我们的地图系统已对 9566 份报告进行了地理编码。我们正在努力解决剩余报告的地点信息问题。
我们还开发了一个工具,可以根据事件摘要文本提取事件的大致海拔高度。但由于原始报告格式各异,该工具无法获取所有事件的海拔高度信息。
我们的系统目前允许用户通过事件摘要中的关键词进行搜索,或者通过筛选最低海拔高度进行搜索。需要注意的是,海拔高度信息是估算得出的,并非包含在原始数据中。我们发现,报告的最高海拔高度为 39,000 英尺,中位数为 1,500 英尺。
您还可以浏览下方嵌入式地图中的案例。鉴于无人机系统 (UAS) 事故在战略基础设施附近频发,我们新增了在地图上标记关键位置的功能,以便更好地查找事故。在初始版本中,我们已将美国运行中的核反应堆位置纳入地图。这些位置以带有电离辐射危害符号的图标进行标记。
请注意,由于事件数量较多,地图加载可能需要一些时间,具体取决于您的网络连接情况,因为数据量很大:
UAVGeography.com,UAVGeography.com 截图,Adam Kehoe
该工具还允许用户按关键词搜索事件报告。上文所述的许多涉及无人机系统的案例都可以在该数据集的案例摘要中找到。事实上,该工具使我们能够重新审视一些案例和地点,从而获得新的线索。我们诚邀读者搜索并与我们分享他们的发现,以便我们进一步调查“特殊”案例。我们将很快发布一篇单独的文章,详细介绍我们正在调查的一些新案例,并将继续追查其他线索。
您也可以通过此链接访问该工具及其全部功能。
我们计划随着时间的推移对系统进行更新和改进。此次工具的初始版本旨在让公众能够快速访问这些数据,尤其是在人们对无人机系统(UAS)日益关注的情况下。随着系统的不断发展,我们计划加入更多搜索和筛选功能。我们还计划进一步改进位置匹配系统以及提取高度信息的能力。此外,汇总报告还包含大量非结构化信息,例如无人机的颜色、尺寸和行为等,这些信息可在未来几周内加以利用。
我们在使用和搜索系统过程中积累的经验,为未来的发展方向提供了一些启示。例如,我们开发了一个独立的工具,使用户能够以三维形式查看事件报告。这项功能在查看城市低空发生大量“扰民”事件的区域时尤为实用。您可以在下方观看一段关于该三维功能的简短视频:
由于成本高昂,我们无法广泛分发该应用程序的3D版本,但我们为有兴趣试用该工具的分析师提供有限的访问权限。请注意,此版本仅包含不同的案例可视化模式,其他数据与开放版本完全相同。
总的来说,我们希望这个工具能够帮助公众更深入地了解无人机事件的规模和严重性。该工具或许还能帮助空中交通管制员和飞行员更好地理解管理日益复杂的空域所面临的艰巨任务。无人机和其他飞行器(例如气球)的数量和种类繁多,给飞行员和机组人员识别目标带来了明显的挑战,尤其考虑到许多报告的物体尺寸相对较小。庞大的开源情报专业人士和爱好者群体或许也能在识别和分析重大事件方面发挥重要作用。有些事件非常特殊,涉及极高的高度和多架飞行器,以及其他一些匪夷所思的因素。一如既往,《战区》将随着新信息和数据的出现持续更新和报道。
我们将很快发布一份初步分析报告,分析我们利用这一新工具发现的独特案例。我们再次恳请读者与我们分享线索,以便我们能够调查数据集中可能隐藏的其他异常事件。
联系作者:Adam@thewarzone.com
评论加载失败,请刷新页面。